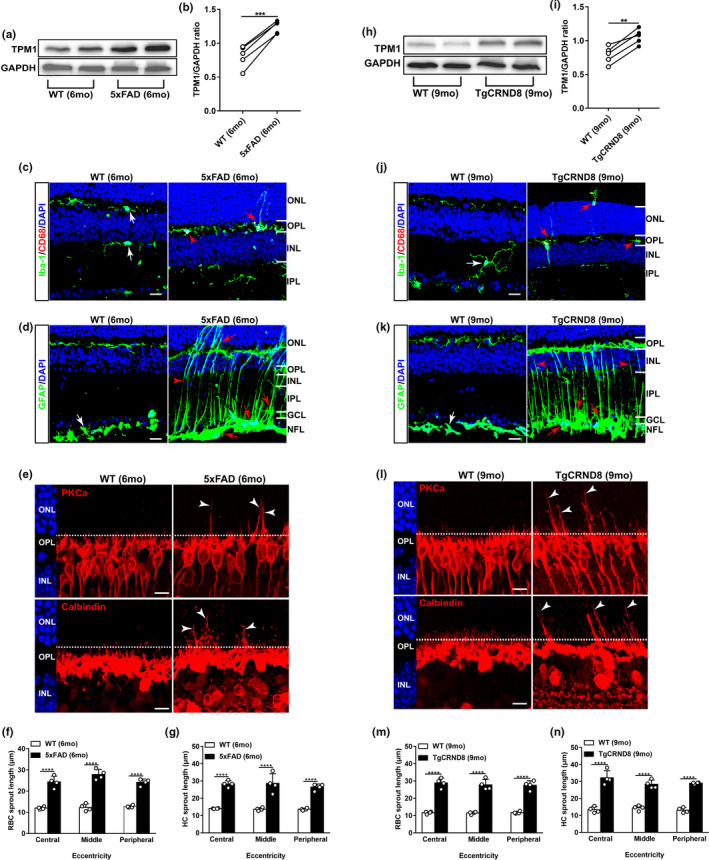
FIGURE 8.

TPM1 upregulation and age‐related retinal alternations in mouse models of Alzheimer's disease. (a–b) Western blot analysis (a) and quantification of TPM1 (b) in C57BL/6J (WT) and 5xFAD retinas. Data are presented as mean ± SEM, n = 5 mice in each group, unpaired two‐tailed Student's t test. (c) Retina sections from WT and 5xFAD retinas were stained with Iba‐1 and CD68. White arrows indicate CD68− microglia. Red arrowhead shows CD68+ microglia, and red arrow indicates the dendritic extension of activated microglia. Scale bars, 20 µm. (d) Retina sections from WT and 5xFAD retinas were stained with GFAP. White arrow shows resting astrocytes. Red arrows show activated astrocytes, and red arrowhead indicates activated Müller cells. Scale bars, 20 µm. (e) Confocal images of RBCs (top row) and HCs (bottom row) in retinal sections from WT and 5xFAD mice. Arrowheads indicate the aberrant sprouting of RBCs and HCs. Scale bars, 10 µm. (f‐g) Quantification of the aberrant dendritic length of RBCs and HCs. Data are presented as mean ± SEM, n = 4 mice in each group, unpaired two‐tailed Student's t test. (h–i) Western blot analysis (h) and quantification of TPM1 (i) in WT and TgCRND8 retinas. Data are presented as mean ± SEM, n = 5 mice in each group, unpaired two‐tailed Student's t test. (j) Retina sections from WT and TgCRND8 retinas were stained with Iba‐1 and CD68. White arrow indicates CD68− microglia. Red arrowheads show CD68+ microglia, and red arrows indicate the dendritic extension of activated microglia. Scale bars, 20 µm. (k) Retina sections from WT and TgCRND8 retinas were stained with GFAP. White arrow shows the resting astrocytes. Red arrows show activated astrocytes, and red arrowheads indicate activated Müller cells. Scale bars, 20 µm. (l) Confocal images of RBCs (top row) and HCs (bottom row) in retinal sections from WT and TgCRND8 mice. Arrowheads indicate the aberrant dendritic sprouting of RBCs and HCs. Scale bars, 10 µm. (m–n) Quantification of the aberrant dendritic length of RBCs and HCs. Data are presented as mean ± SEM, n = 4 mice in each group, unpaired two‐tailed Student's t test
