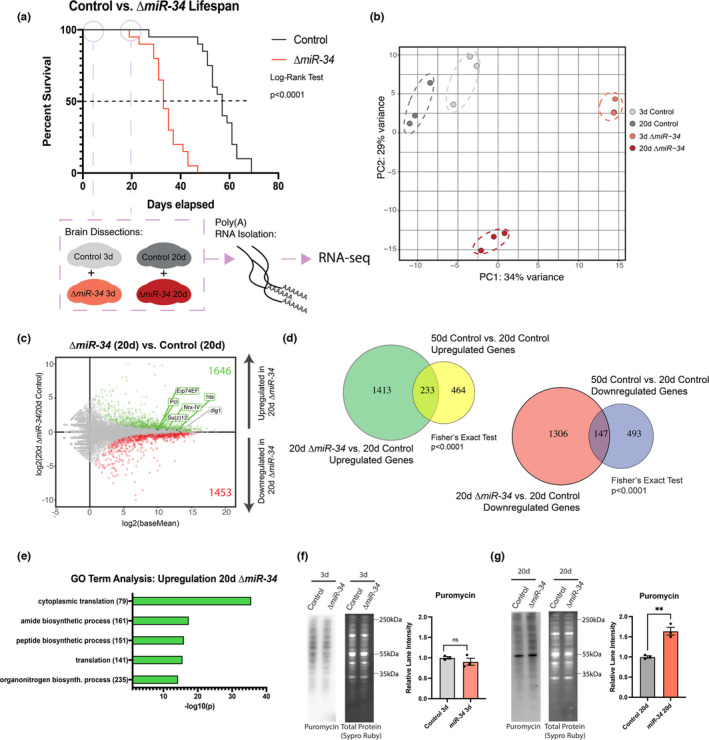
FIGURE 1.

miR‐34 mutants have increased translation activity in the brain with age. (a) Lifespan curve highlighting 3d and 20d RNA‐seq time points for control and miR‐34 mutant animals (n = 120 flies/condition). (b) Principal component analysis of transcriptome time points for control and miR‐34 mutant brains (3d, 20d). (c) MA plot showing differential gene expression for 20d miR‐34 vs. control brains. Green dots represent genes upregulated in miR‐34 mutant (p adj < 0.05). Red dots represent genes downregulated in the miR‐34 mutant (p adj < 0.05). Six validated targets of miR‐34 are highlighted. (d) Venn diagram showing significant overlap between genes that are significantly upregulated (left, 5.25‐fold over‐enriched) and significantly downregulated (right, 3.37‐fold over‐enriched) in 20d miR‐34 vs. control brain and genes up or downregulation in 50d vs. 20d control brains. (e) Gene ontology (GO) term analysis for significantly upregulated genes (20d miR‐34 vs. control) showing top 5 pathways. (f) Western immunoblots of puromycin‐labeled protein in control and miR‐34 mutant brains (3d). No significant difference (n=3 biological replicates, mean ± SEM, Student's t test). (g) Western immunoblots of puromycin‐labeled proteins in control and miR‐34 mutant brains (20d). miR‐34 mutants have a higher level of puromycin‐labeled protein. (n=3 biological replicates, mean ± SEM, Student's t test). Significance: **p < 0.01
