
Fig. 2. Impact of SASE spectral diagnostic inaccuracy.
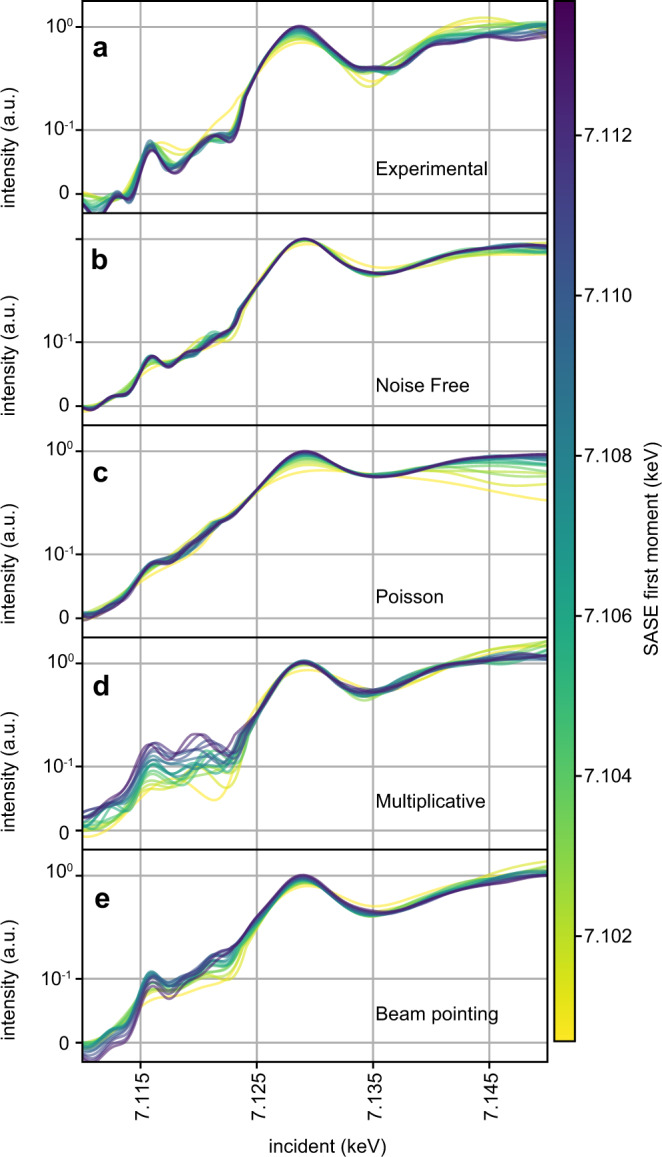
In each panel, we plot the Fe HERFD absorption spectra fit to 17 independent subsets of the data, each containing 10k shots. The spectra are color coded by the average first moment of the SASE spectral diagnostic used for each independent fit (color bar in units of keV) (see Supplementary Fig. 3a). The spectra are scaled with a symmetric log function to enhance dynamic range of the plot and show variance of the fit in both pre-edge and above edge regions. Panel a is fit to experimental data. Panels b–e are fit using synthetically generated emission signals created using the same SASE spectral intensity measurements used in panel a. In panel b, no additional noise is added to the SASE spectral measurements during the reconstruction. In panel c, shot noise is added to the SASE spectral diagnostic such that around 330 photons are distributed over 200 pixels in each shot. In the actual experiment, each shot has around 5–10× more photons than this, so the effect shown here is exaggerated to highlight the effect this kind of noise has. In panel d, the SASE spectral diagnostic is corrupted by a random, smooth multiplicative filter to simulate spectra distorted by intensity profile fluctuations. In panel e, a Gaussian intensity filter of fixed width, but with mean that depends linearly on the SASE first moment is applied to simulate beam pointing that changes slightly with central photon energy.