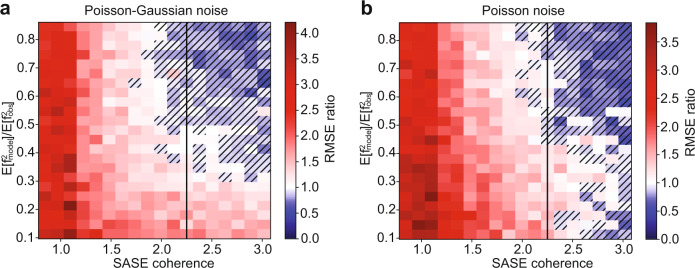
Fig. 3. Relative performance of stochastic spectroscopy to monochromatic spectroscopy.
We examine the merits of stochastic signal recovery to monochromatic signal recovery as a function of detector noise type (panels), amount of detector noise (vertical axis), and a similarity metric of SASE shots (horizontal axis). Poisson or shot noise is used in panel b, while in panel a, shot-noise plus Gaussian read noise (Poisson–Gaussian) is used. No noise is added to the SASE spectral diagnostic. The amount of detector noise applied is determined by a ratio of the 2nd moment of the noiseless signal to the noisy signal. A ratio of 1.0 indicates that the detector noise model contributes negligibly to the 2nd moment (a high quality signal), while a ratio of near zero indicates a measurement dominated by detector noise. SASE coherence, defined in the text, is smaller for collections of shots which are less similar (have smaller inner product). Each pixel in panels a and b depicts a ratio: the RMSE for signal recovered using monochromatized light divided by the RMSE of the signal recovered using the full SASE bandwidth. Each pixel represents the median RMSE ratio of 10 simulated experiments, with 100k shots each. The black line on each image shows the experimentally observed coherence of the SASE light in Fig. 1 as a point of reference.

