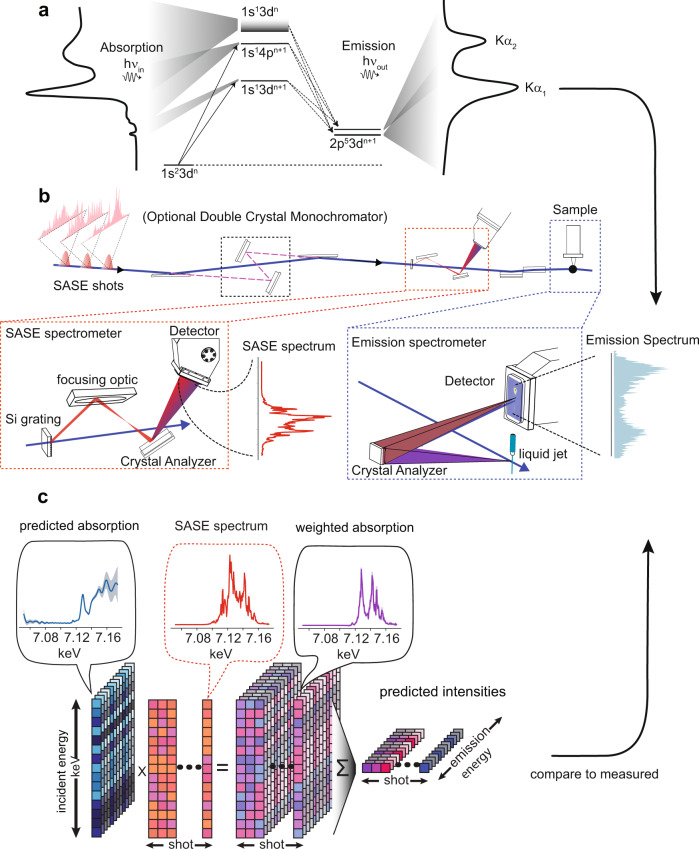
Fig. 4. Setup and signal generation overview.
A cartoon in panel a depicts the atomic transitions involved in K-edge absorption and 1s2p emission of Iron. The beamline configuration used for data collected is shown in panel b and shows how the beamline can switch between full bandwidth SASE and monochromatized SASE upstream of both spectrometers. Details of the SASE spectrometer and emission spectrometer are highlighted. The SASE spectrometer works by sampling a collimated beam using a silicon grating and then dispersing the spectral content of the beam onto a pixel array detector via a flat Si 220 analyzer crystal coupled to a reflective focusing optic. A von Hamos configuration is used for emission detection, wherein a single cylindrically bent crystal collects sample emission perpendicular to the beam, re-images, and energy disperses it onto a pixel array detector. Panel c depicts the model used for analysis. For each detected emission energy, a proposed absorption spectrum is weighed by the measured SASE spectrum and then sum reduced to form a proposed emission intensity.

