FIG. 3.

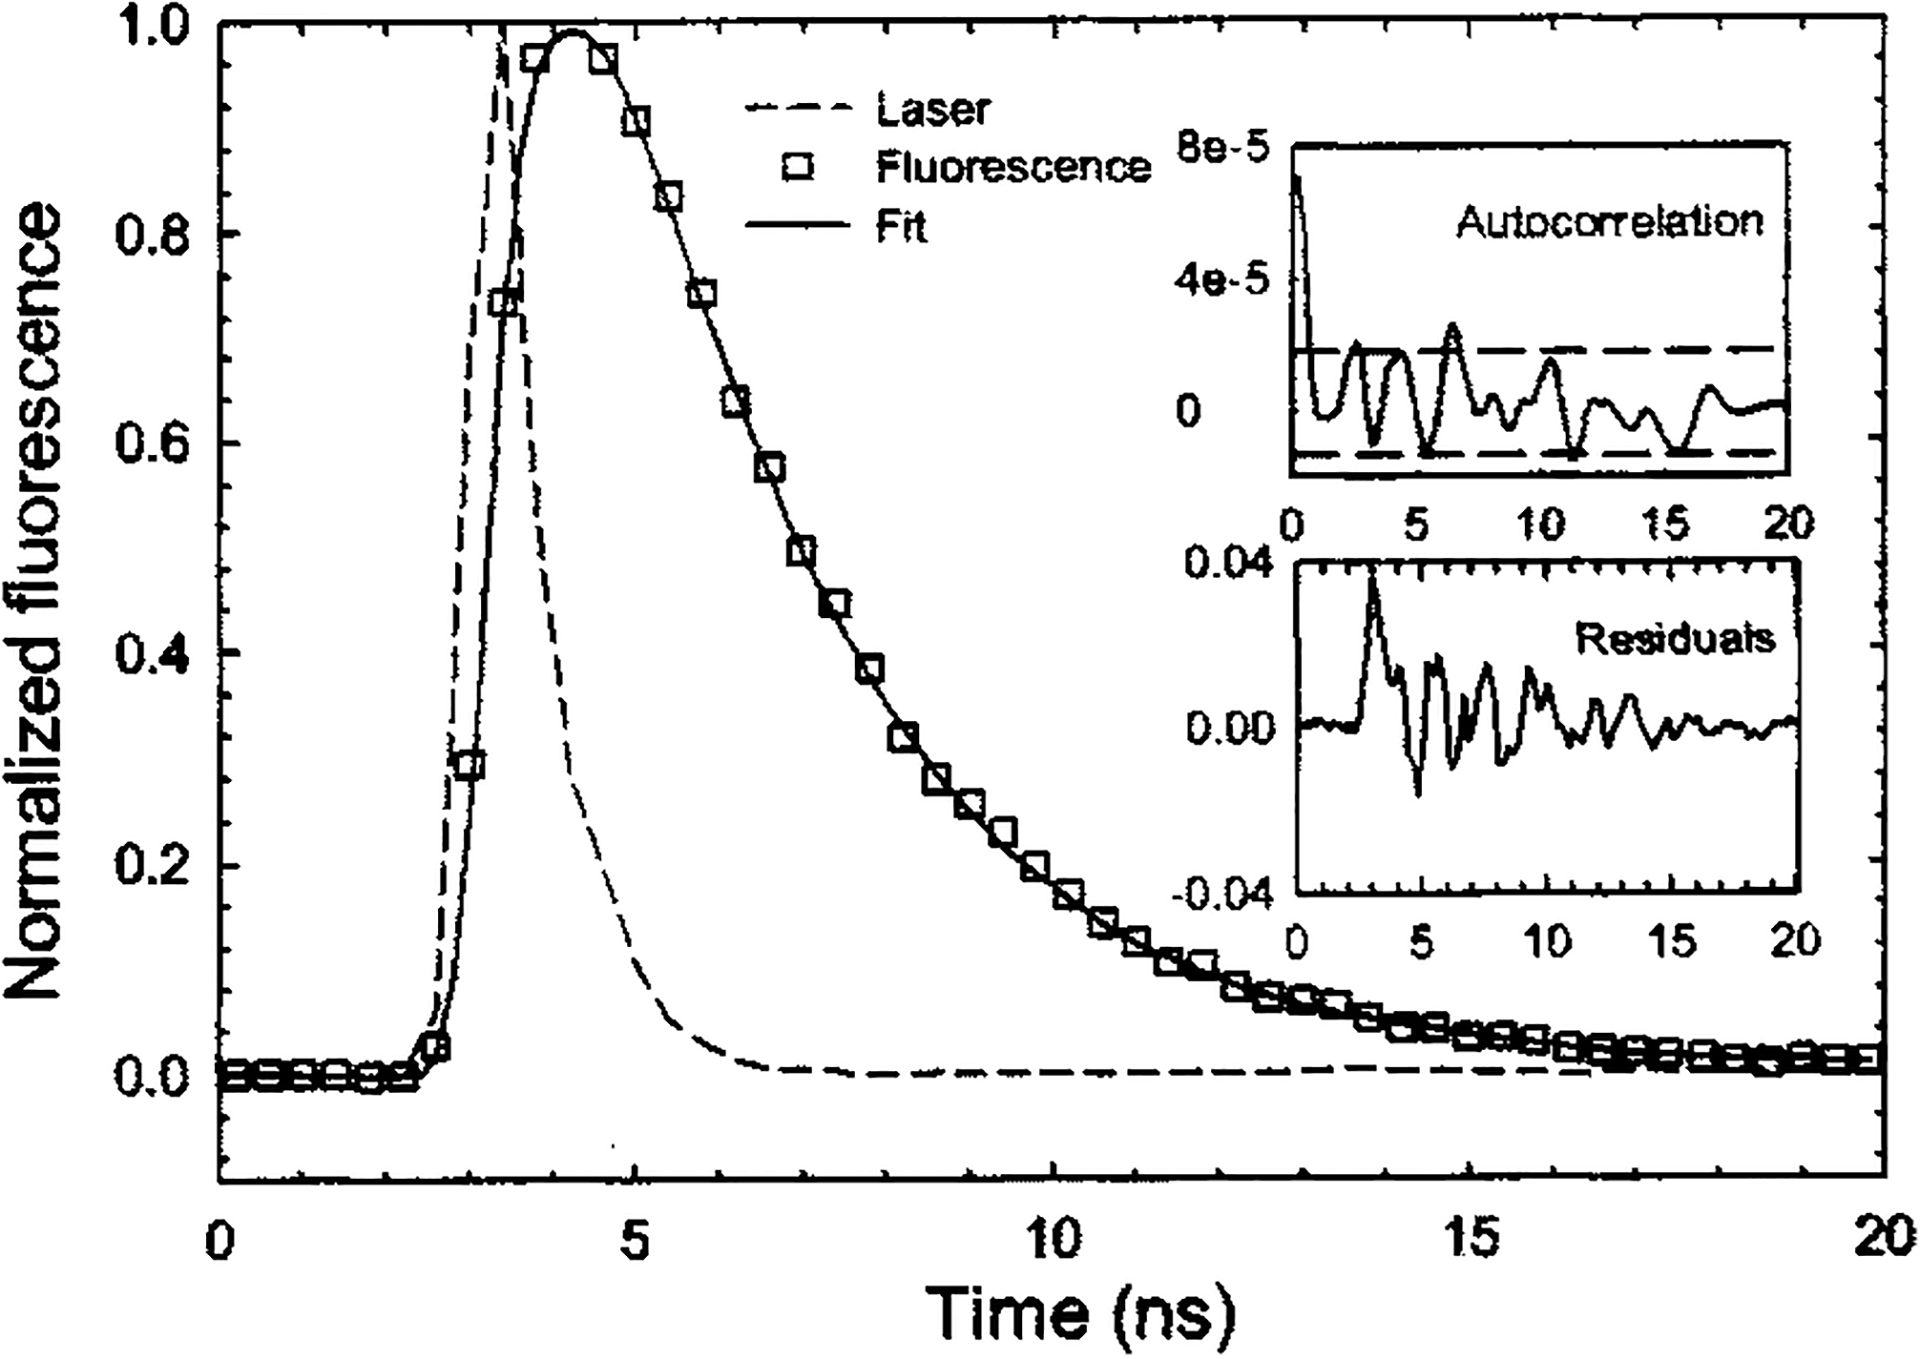
Excitation laser pulse and Rhodamin B fluorescence emission response (experimental data and theoretical fit). Residuals are nearly randomly distributed. Autocorrelation of the residuals is mostly contained within the 95% confidence interval.

Excitation laser pulse and Rhodamin B fluorescence emission response (experimental data and theoretical fit). Residuals are nearly randomly distributed. Autocorrelation of the residuals is mostly contained within the 95% confidence interval.