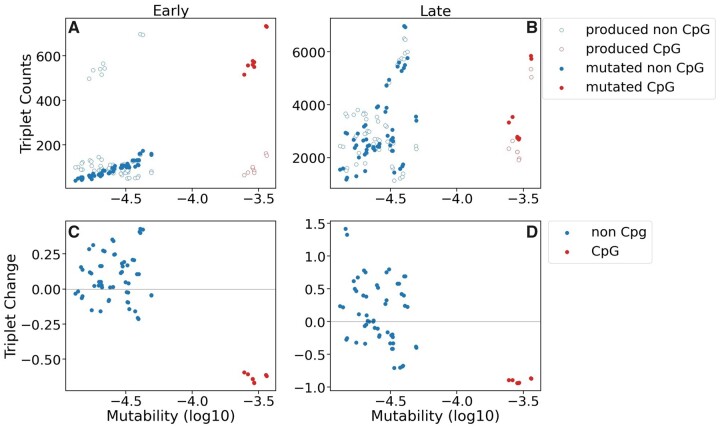
Fig. 1.
Relationship of trinucleotide mutability with trinucleotide variation in early (10% mutational coverage) and late (200% mutational coverage) stage simulations. Panels (A) and (B) display the number of times a trinucleotide is chosen to mutate in the simulation (filled) and how many times a trinucleotide is produced from a mutation event (open) in early (A) and late (B) stage simulations. Panels (C) and (D) display average trinucleotide change proportional to initial frequencies in early (C) and late (D) stage simulations. Gray horizontal line denotes the zero mark, indicating no change from the initial state. Negative values indicate decrease in frequency from the initial state, and positive values denote increases in frequency. Data for all panels was generated using ∼100 Kbp of randomly generated sequence with no purifying selection (n = 10).

