
Fig. 2.
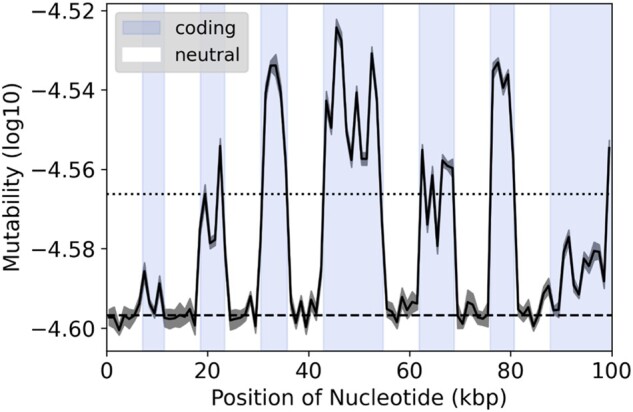
Sliding window of mutability from a simulated chromosome. The chromosome consists of ∼100 Kbp of coding (blue) and noncoding (white) regions at a ∼1:1 ratio in an alternating pattern, simulated for 200k iterations. Mutability is calculated as log10 values from the frequencies of trinucleotides in nonoverlapping windows of 1 kb. Dark gray ribbon represents standard error between replicate simulations (n = 10). The dotted and dashed lines represent the average mutability for all coding and non-coding regions, respectively.