
Figure 4.
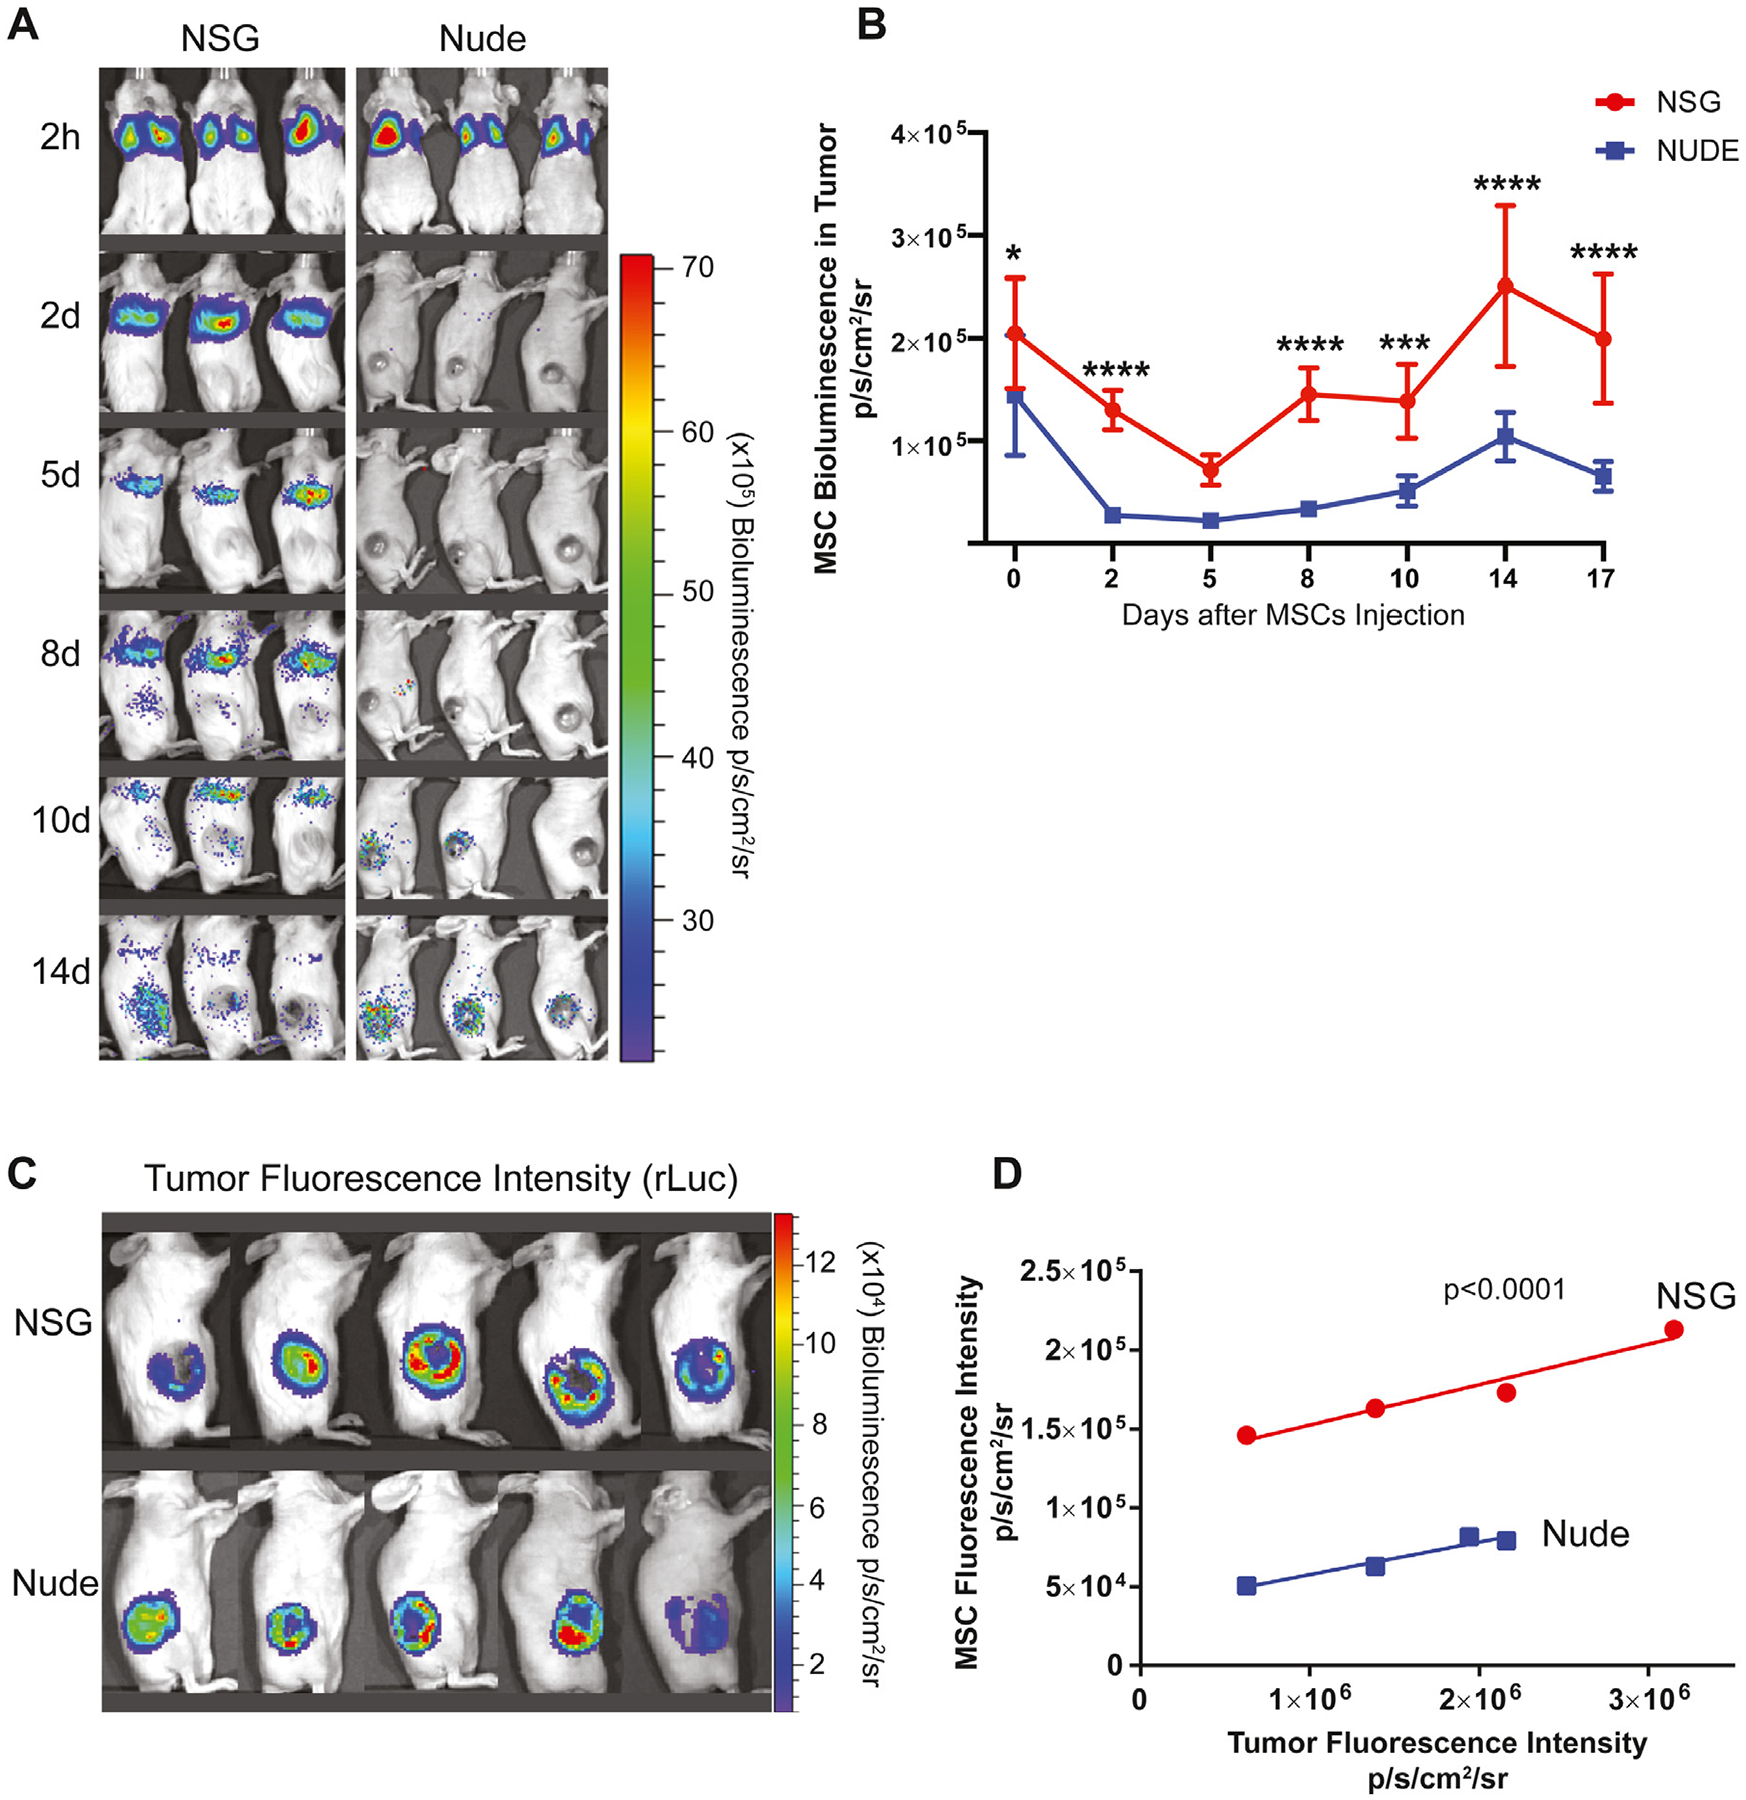
Biodistribution of MSCs in nude and NSG tumor models. (A) The ffLuc MSCs were injected intravenously into nude and NSG mice and imaged on day 1, day 2, day 5, day 8, day 10 and day 14 post-injection using Xenogen IVIS. (B) Bioluminescence signal was quantified in the tumors of nude and NSG groups. (C) Tumor sizes were measured with bioluminescence imaging using coelentrazine substrate in rLuc OS17 tumor-bearing nude and NSG animals. (D) Correlation between tumor sizes and MSC migration was quantified in both animal models. Data were analyzed using a linear mixed-effects model and post hoc pairwise comparisons. Tukey-adjusted Pvalues were used to determine significance. ***P< 0.001, ****P< 0.0001. IVIS, in vivo imaging system.