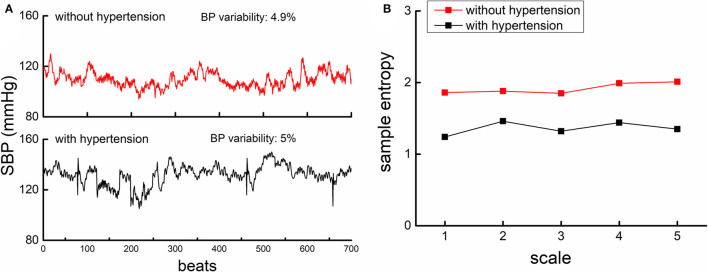
Figure 1.
The beat-to-beat SBP series (A) and MSE curves (B) from one participant with hypertension (lower panel of A, black) and another participant without hypertension (upper panel of A, red). (A). An example of the beat-to-beat SBP series from one participant without hypertension (upper left panel) and from one participant with hypertension (lower left panel). Both participants had similar BP mean level and BP variability as displayed in the figure. (B) shows the MSE curve calculated from the SBP series of these two participants. The entropies of the participant with hypertension were lower than that of participants without, across all the five scales. This suggested that the complexity of SBP fluctuation was lower in hypertensive as compared to non-hypertensive, while the BP variability was similar.

