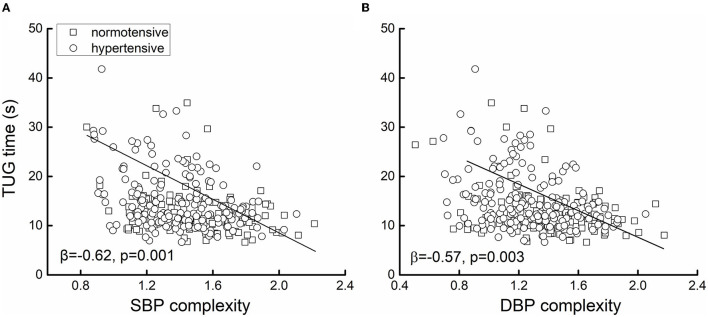
Figure 2.
The association between systolic blood pressure (SBP) (A) and diastolic blood pressure (DBP) (B) complexity and mobility. The mobility was measured by the time to complete the timed-up-and-go test (i.e., TUG time). Greater TUG time reflected poorer mobility. Linear regression analyses adjusted for age, sex, body mass index (BMI), alcoholic and smoking status, hypertension, the use of antihypertension medication, and the duration of hypertension showed that in the 400 older adults, lower SBP (β = −0.62, p < 0.0001) and/or DBP (β = −0.57, p = 0.003) complexity was associated with greater TUG time (i.e., worse mobility). Different markers on the figure presented the hypertensive status [i.e., hypertensive (n = 247) or normotensive (n = 153)].

