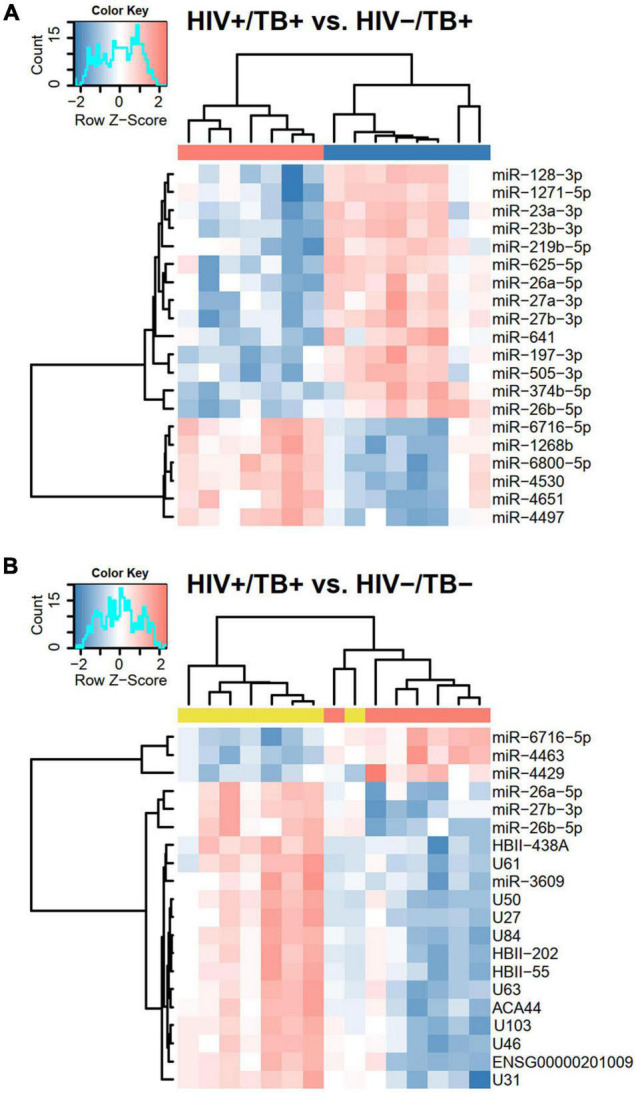
FIGURE 4.

Heatmaps based on hierarchical clustering analyses including (A) HIV+/TB+ and HIV-/TB+ and (B) HIV-/TB- and HIV+/TB+ subjects and the 20 sncRNAs that generated the smallest P-values in Limma analysis from the respective comparisons. Microarray data were median centered before the analysis. Pearson’s correlation was used as a distance matrix. The red and blue colors indicate upregulated and downregulated sncRNAs, respectively. Color codes at the top represent infection status, HIV+/TB+ (red), HIV-/TB+ (blue), and HIV-/TB- (yellow). Probe HBII-438A also assigned to HBII-438B, probe U84 to ENSG00000263442/ENSG00000264591/ENSG00000265325/ENSG00000265607/ENSG00000266646/ENSG00000266755, probe ACA44 to ENSG00000252840, and probe U103 to U103B.
