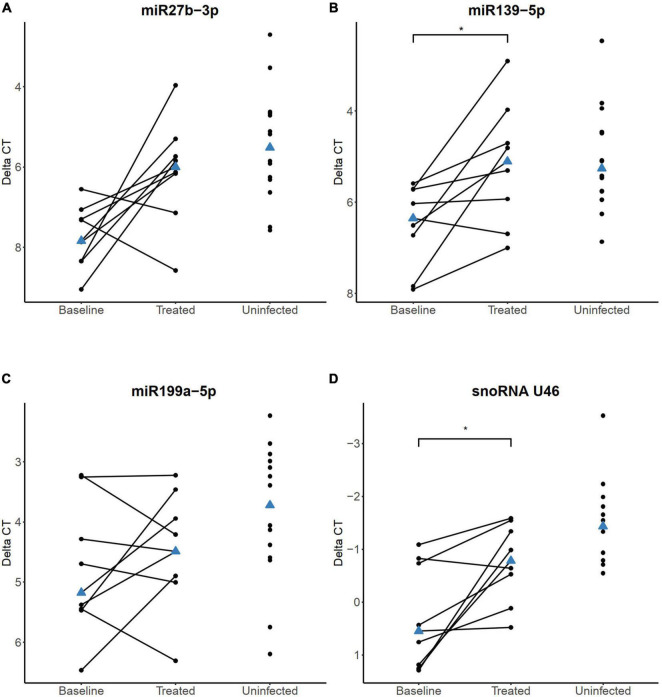
FIGURE 6.
sncRNA expression levels quantified by RT-qPCR in HIV+/TB+ study participants before and after the initiation of anti-tuberculosis treatment and antiretroviral treatment (A) miR-27, (B) miR-139-5p, (C) miR-199a-5p, and (D) snoRNA U46. Paired samples of participants longitudinally followed before and during treatment are connected with a line. HIV-/TB- control group is included in all plots for comparison. The blue triangle indicates the median value. *Adjusted P < 0.05. P-values were calculated from paired samples Wilcoxon test with Holm-Bonferroni correction.

