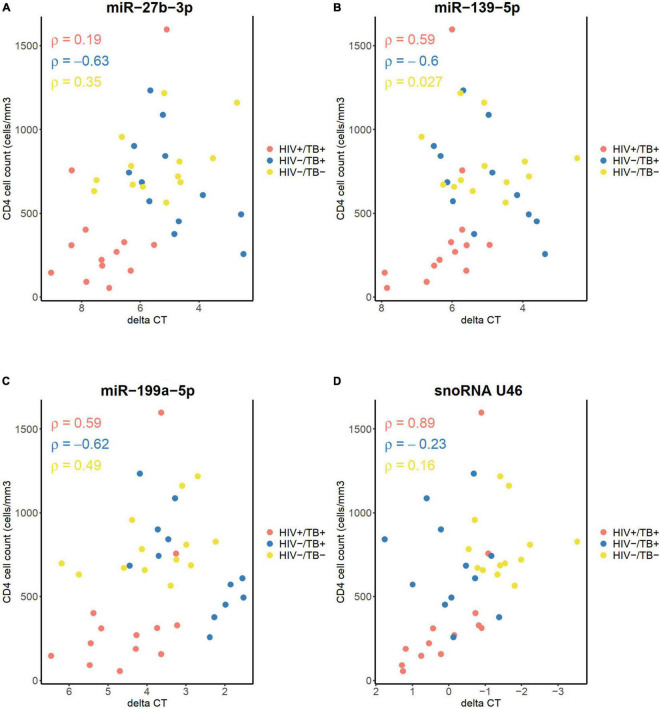
FIGURE 7.
Correlation between CD4+ cell count before treatment, and the levels of (A) miR-27b-3p, (B) miR-139-5p, (C) miR-199a-5p, and (D) snoRNA U46, measured by qPCR. Infection status is represented by color, HIV+/TB+ (red), HIV-/TB+ (blue) and HIV-/TB- (yellow). Spearman’s rho is indicated for each group in the matching color.

