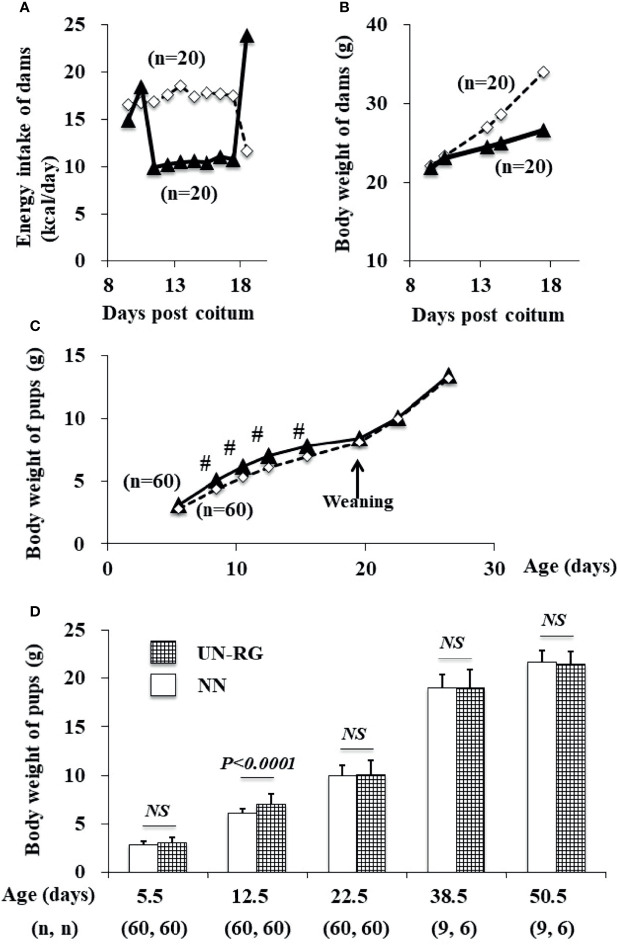
Figure 2.
Changes in the energy intake (A) and body weight (B) of dams during pregnancy and in the body weight of pups (C, D) before HFD. White rectangles indicate NN dams (A, B) and pups (C). Black triangles indicate UN (A, B) dams and UN-RG pups (C). Means of the data were plotted (A–C). #P < 0.01. NS, no statistical significance.

