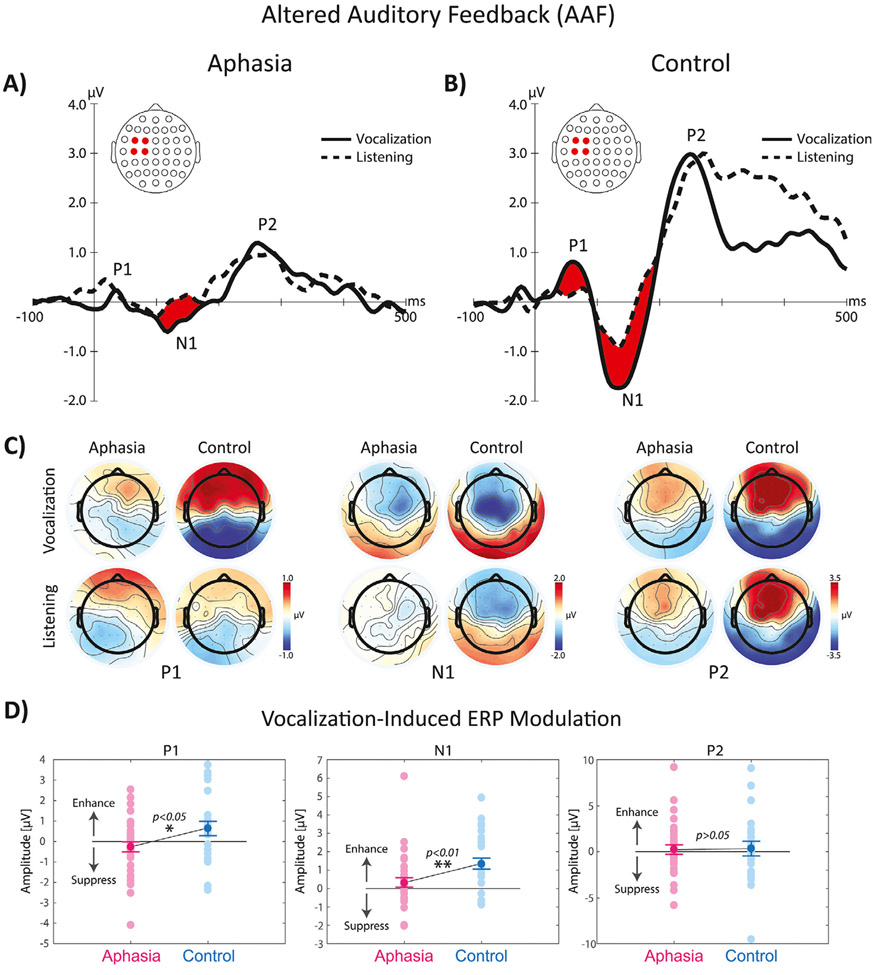
Fig. 3.
The overlaid profiles of ERP responses to AAF at the onset of pitch-shift stimuli during vowel sound vocalization and listening tasks in fronto-central electrode in A) aphasia (left panel) vs. B) control subjects (right panel). Highlighted areas in red color indicate time ranges of significant differences between vocalization vs. listening. C) Shows the topographical distribution maps of ERP activity in 64 electrodes for the P1, N1, and P2 ERP responses for vocalization and listening tasks across aphasia and control subjects. D) Shows the raster plot of individual subjects and group differences in the amplitude of vocalization-induced modulation of ERP activity in aphasia vs. control group.

