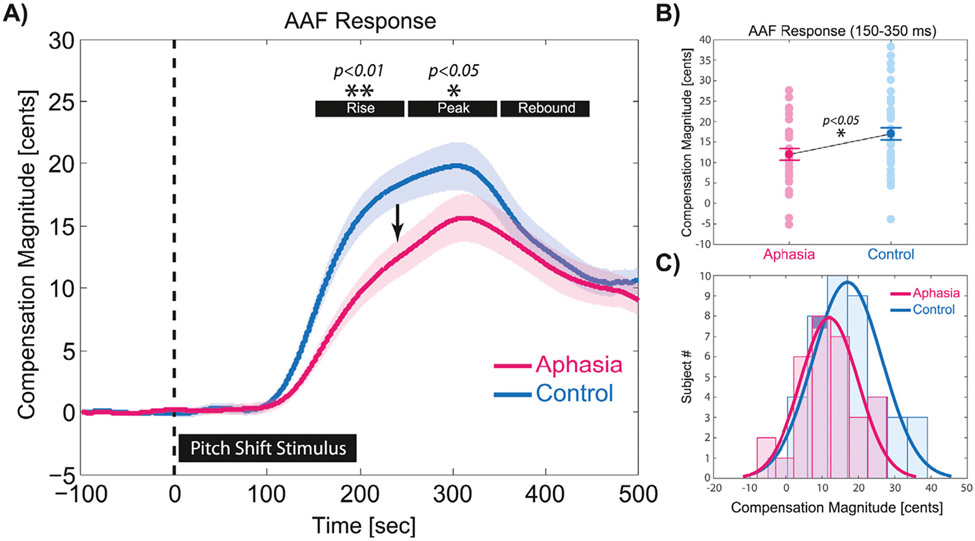
Fig. 4.
A) The overlaid profiles of vocal compensation responses averaged for upward (+100 cents) and downward (−100 cents) pitch-shift stimuli in aphasia (n = 34) and control (n = 46) subjects. Highlighted time windows represent the rise (150 – 250 ms), peak (250 – 350 ms), and rebound (350 – 450 ms) phases of responses in each group. B) Shows the raster plot of individual subjects and group differences in the magnitude of vocal compensations averaged within the rise and peak time windows (150 – 350 ms) in aphasia vs. control group. C) Shows the histogram plot and normal distribution curves for vocal compensation magnitudes in aphasia vs. control groups averaged within the rise and peak time windows.

