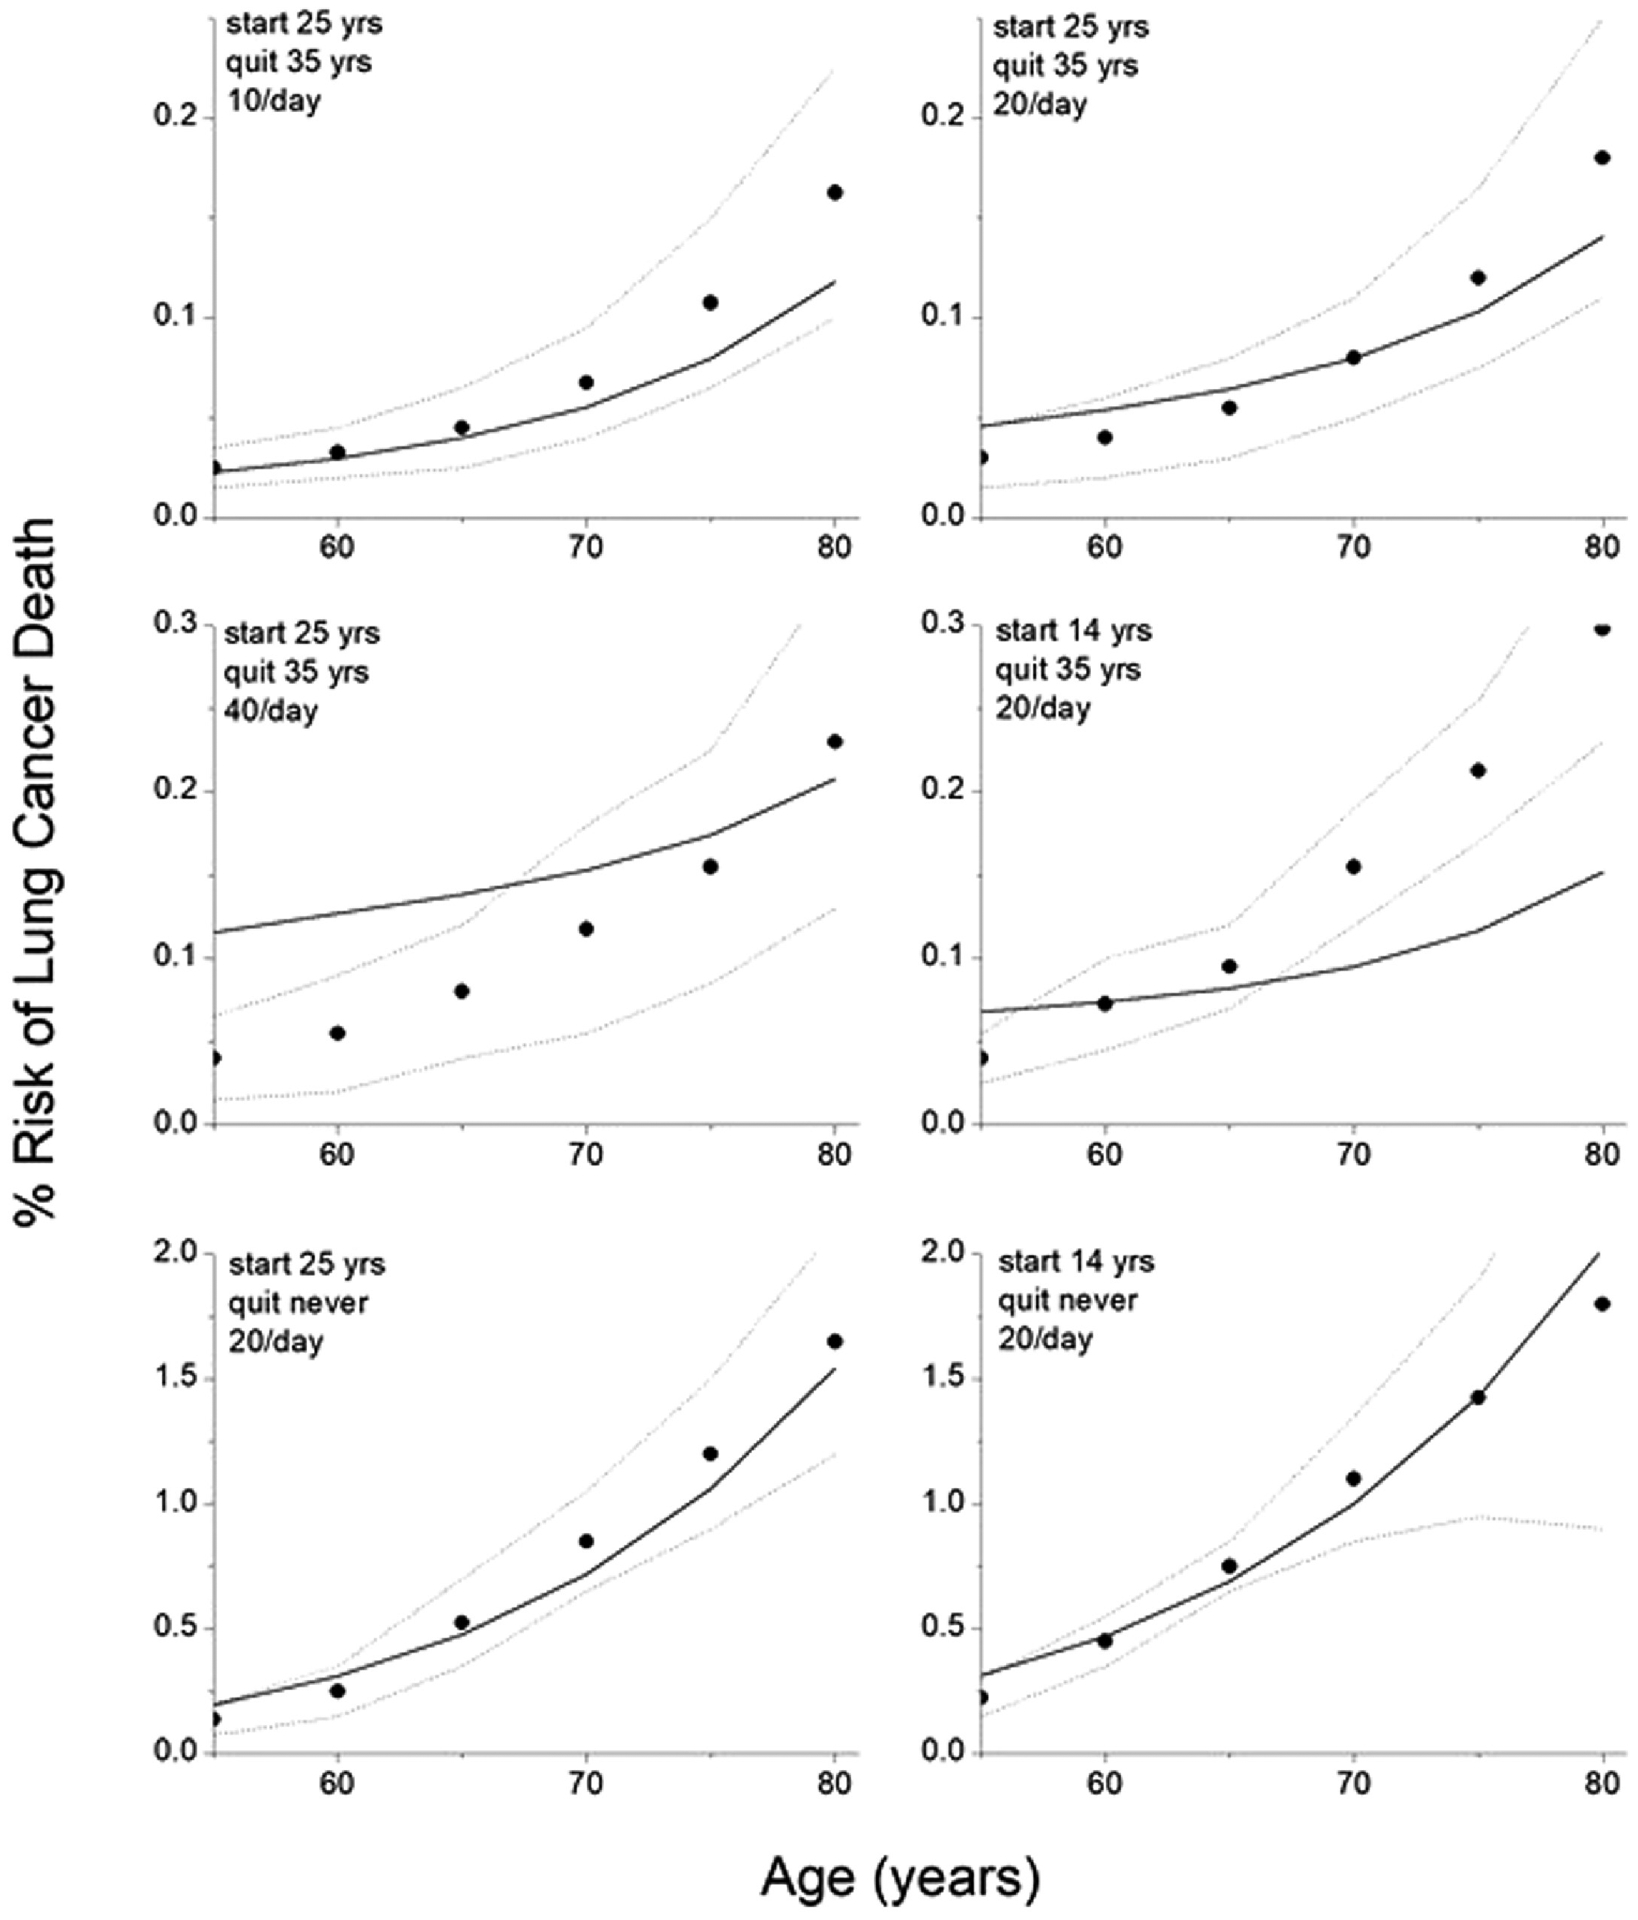
Figure 2:

Fits of model CISNET model predictions for 6 different smoking histories to CISNET model predictions for 6 different smoking histories. The model fits provided by equation 2 combined with equations 3 and 5 are shown by the solid curves. The closed circles are the mean CISNET model predictions to which the model was fit. The upper and lower bounds of the CISNET model predictions are shown by the dashed curves.
