
Figure 1.
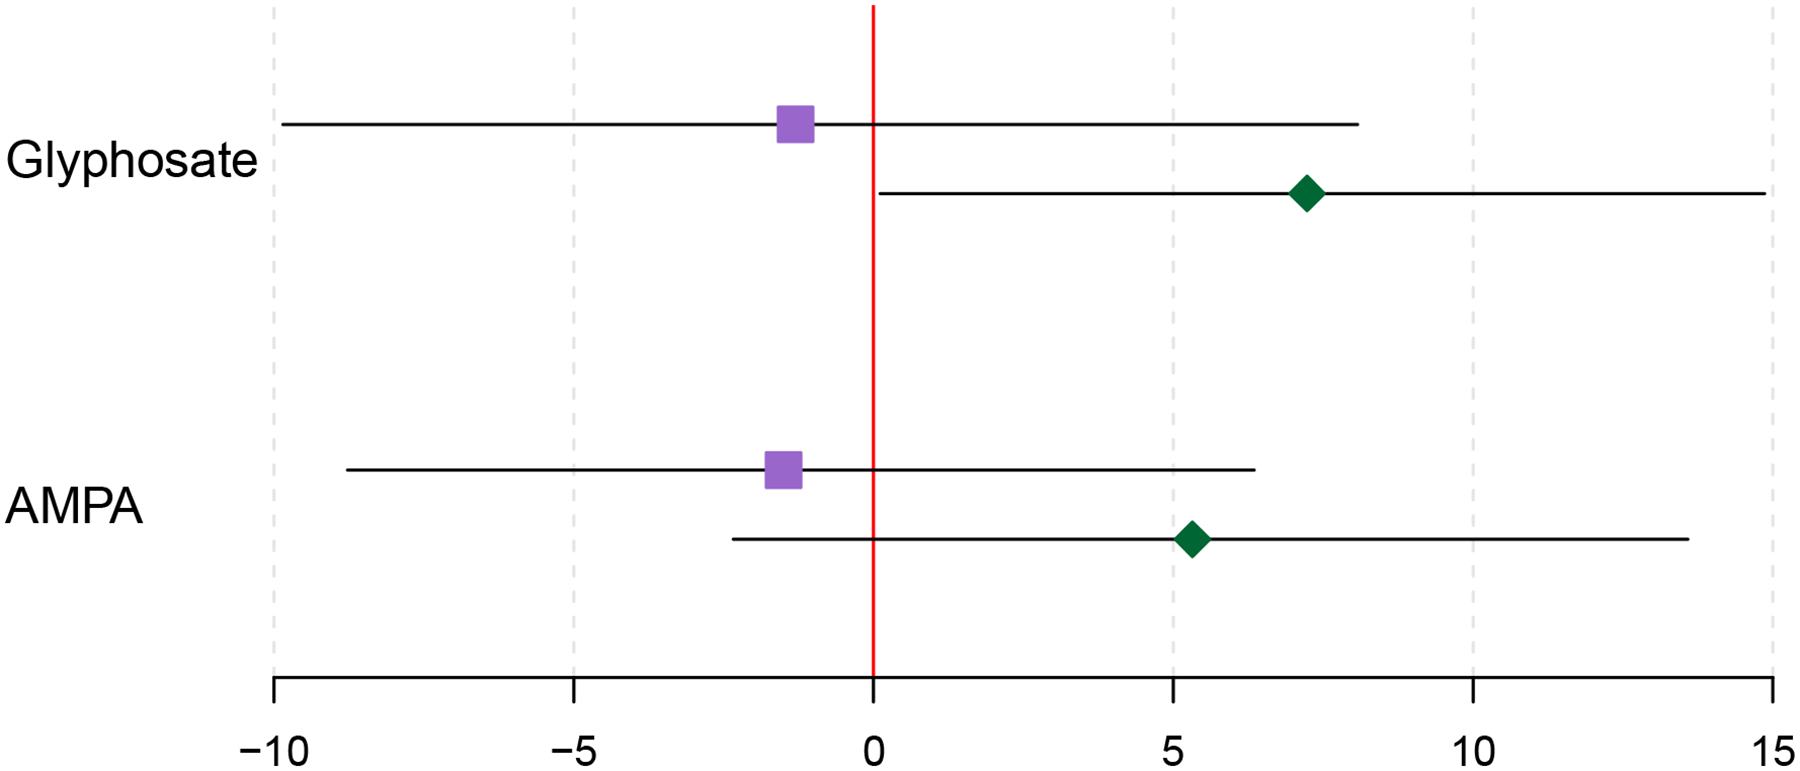
Percent change in 8-Iso-PGF2α with an IQR increase in oxidative stress biomarkers, stratified by study visit. Purple boxes denote estimates for visit 1 and green diamonds denote estimates for visit 3. Models adjust for specific gravity and categorical forms of maternal age, education level, annual household income, smoking, and alcohol consumption.