

Abstract
Although important for the acquisition of later math skills, fractions are notoriously difficult. Previous studies have shown that higher math anxiety (MA) is associated with lower performance in symbolic fraction tasks in adults and have suggested that MA may negatively impact the acquisition of fractions in children. However, the effects of MA on fraction skills in school-aged children remain underexplored. We, therefore, investigated the impact of MA on the performance of younger (2nd and 3rd graders) and older (5th and 6th graders) children in math fluency (MF), written calculation, fraction knowledge (FK), and symbolic fraction and nonsymbolic ratio processing. On the basis of our prior work suggesting a perceptual foundation for fraction processing, we predicted that symbolic, but not nonsymbolic, math skills (especially fractions) would be impaired by MA. As predicted, higher MA was associated with lower performance in general mathematics achievement and symbolic fraction tasks, but nonsymbolic ratio processing was not affected by MA in either age group. Furthermore, working memory capacity partially mediated the effects of MA on general mathematics achievement, FK, and symbolic fraction processing. These results suggest that understanding the bidirectional interactions between MA and fractions may be important for helping children acquire these critical skills.
Keywords: math anxiety, working memory, fraction knowledge, ratio processing, RPS, mathematics
Graphical abstract:
On the basis of our prior work suggesting a perceptual foundation for fraction processing, we predicted that symbolic, but not nonsymbolic, math skills would be impaired by math anxiety (MA). As predicted, higher MA was associated with lower performance in general mathematics achievement and symbolic fraction tasks, but nonsymbolic ratio processing was not affected by MA in either age group. Furthermore, working memory capacity partially mediated the effects of MA on general mathematics achievement, FK, and symbolic fraction processing. These results suggest that understanding the bidirectional interactions between MA and fractions may be important for helping children acquire these critical skills.
Introduction
Math anxiety (MA) is the feeling of fear, apprehension, or discomfort toward mathematics, which can affect both children and adults.1,2 An extensive body of literature has shown that higher MA is associated with lower performance in mathematics tasks.3–7 Since MA was first identified, different hypotheses have been proposed to account for the association between MA and math achievement.8 Early hypotheses assumed that difficulties with mathematics led to increasing anxiety about math.9–13 However, more recent arguments suggest a bidirectional association between MA and mathematics difficulties.14,15 The bidirectional account suggests that increases in MA lead to lower math achievement, and lower math achievement leads to increased MA.14,15 Children with higher MA experience negative feelings when working on mathematics tasks and to avoid triggering these negative feelings; they may dedicate less time and effort to studying mathematics. This mathematics avoidance then leads to lower mathematics achievement, which, in turn, further increases MA, thereby establishing a vicious cycle.16,17
The effects of MA on performance and its mechanisms have been extensively explored in mathematics broadly.15 However, less attention has been given to the differential effects of MA on specific domains of mathematics. Recent work has started to address this gap by investigating the effects of MA on domains such as fractions and algebra.18,19 For example, Sidney et al.18 found that 5th/6th grade children and adults have more negative attitudes toward fractions than whole numbers, regardless of their performance.18 However, it is still unclear how these negative attitudes impact performance on specific mathematics domains across development.
MA association with fraction skills
Fraction knowledge (FK) has emerged as one of the most important predictors of advanced mathematics skills.20–22 For example, fraction skills at age 10 uniquely predict high school algebra.23 Despite their importance, fractions are notoriously difficult: both children and adults struggle with this domain.24–28 Because of the importance of fractions and the difficulties associated with them, the academic community has given increasing attention to the cognitive processes underlying FK.29,30 However, cognitive processes are not the whole story; success with fractions may depend critically on affective factors, such as MA, as well.
Fraction skills may be an interesting case for studying the effects of MA. Traditionally, fraction instruction is part of more advanced mathematics curricula, when effects of MA may be more robust in children.2,31 Furthermore, both children and adults have difficulties with fraction tasks and associate them with negative feelings and attitudes.18 People’s difficulties with fractions may result from the interference of their previous knowledge about whole numbers, which is known as the whole number bias.32 Because of the whole number bias, fraction tasks may be highly demanding of cognitive resources,33 which may exacerbate MA effects. Taken together, these factors suggest that MA may have a greater impact on fractions than on more basic whole number processing.
To the best of our knowledge, only two studies have directly investigated the effects of MA on fraction skills. Rayner and colleagues34 have shown that preservice teachers with high MA are more likely to have lower performance in FK tasks than their colleagues with lower MA. Additionally, a recent study with undergraduate students showed that higher MA is associated with lower accuracy in a fraction comparison task (e.g., ) and a fraction number line task (e.g., placing in a number line ranging from 0 to 5).35
Despite the evidence that MA may negatively affect performance in symbolic fraction tasks in adults, previous studies remain unclear how MA impacts children’s fraction skills. Learning about fractions may be one of the first places that children encounter serious difficulties with math, and they may develop negative attitudes toward mathematics in general as a result.19 Students who were not previously math-anxious could begin to experience MA due to the difficulties of learning about fractions, which would then persist into later, more advanced domains of mathematics. In the current study, we provide some initial insights into this question by measuring MA and its impact on math skills, especially fractions skills, in children across the years when fractions are first acquired.
Differential effects of MA on distinct mathematics tasks
One of the mechanisms by which anxiety may impact performance is working memory (WM) exhaustion.36 When working on mathematics problems, people with high MA may experience intrusive thoughts that leave them with fewer WM resources available.3,37 Beilock and Carr38 have shown that high MA was more harmful to undergraduate participants who relied on WM intensive strategies to solve an arithmetic task compared with their peers who used other strategies. These results have also been replicated with children. Ramirez and colleagues6 have found a stronger association between MA and math achievement in first and second graders who used WM intensive strategies to solve mathematics word problems in comparison with their peers who used different strategies.
Additionally, MA may differently impact distinct numerical processes—even within the same participants—depending on their efficiency.3,37,39 Efficient processes are executed rapidly and with a lower WM load. By contrast, less efficient processes require greater effort and time and are usually more prone to errors.40–42 The literature on whole numbers has shown that MA negatively impacts less efficient processes, such as symbolic number processing.43,44 However, no significant association between MA and highly efficient processes, such as nonsymbolic absolute magnitude processing, has been observed.11,12,45–47
Aligned with the results observed in the whole number literature, we predict that MA will have a greater impact on less efficient fraction skills. Recent studies have suggested that nonsymbolic ratio processing is more efficient than symbolic fraction processing. Our research group has argued that we have a neurocognitive architecture dedicated to processing nonsymbolic ratios, such as the relative length of two pairs of lines (see Fig. 1C), which may serve as a start-up tool for FK similar to the approximate number system (ANS) for whole numbers.29 This “ratio processing system” (RPS) may develop early and be at least partially independent of schooling, given that children who have not been introduced to fractions in schools have high performance in RPS tasks.48,49 The RPS theory and empirical results suggest that this system is intuitive and highly efficient.29,50 By contrast, studies with symbolic fraction tasks indicate that they are less efficient and are highly demanding of WM resources.33 To date, the differential impacts of MA on nonsymbolic ratio and symbolic fraction skills have been unexplored.
Figure 1.
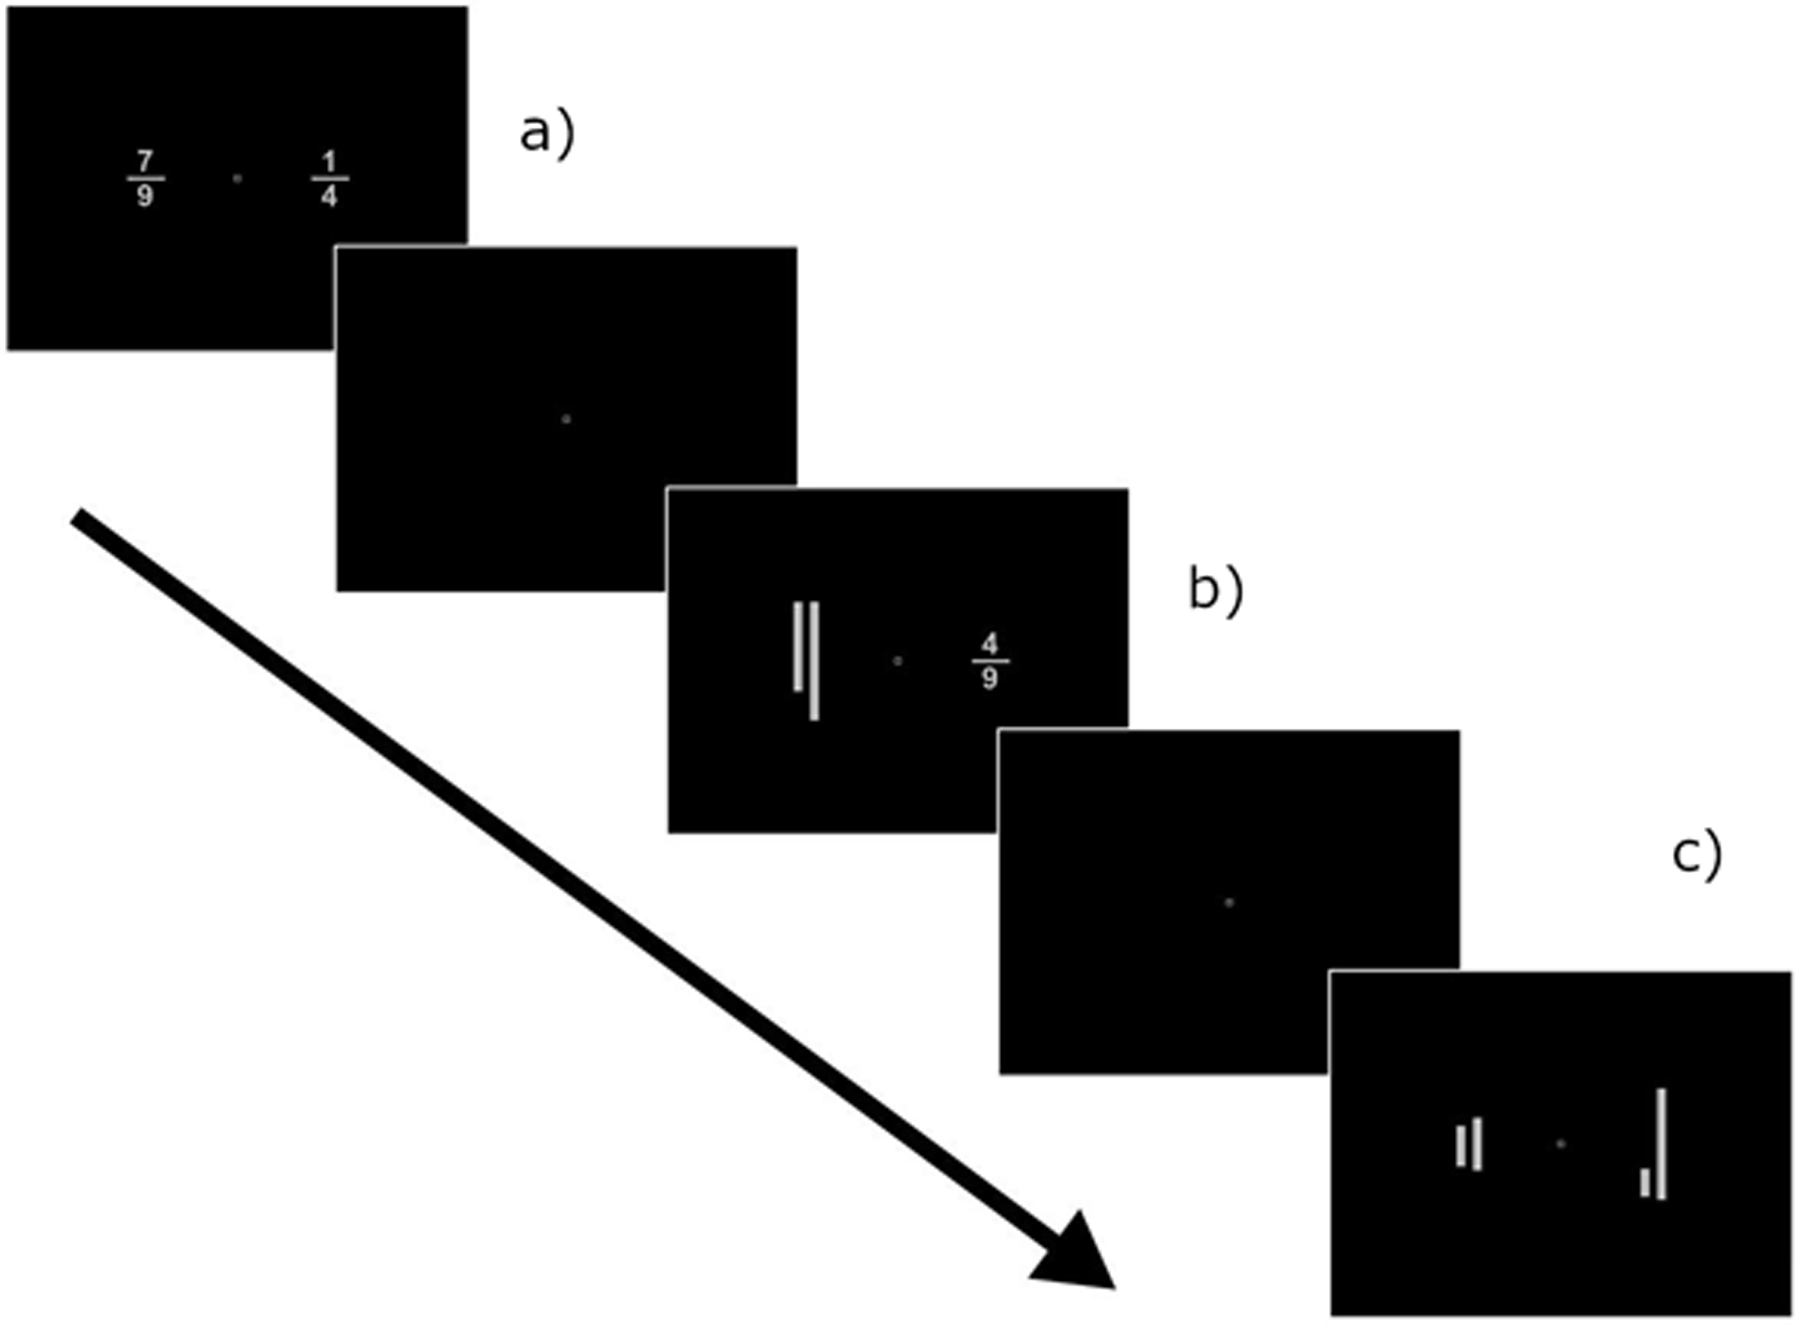
The cross-format fraction comparison task. In this task, participants are presented with two different ratios and should indicate the larger. (A) Symbolic fraction comparisons: participants should indicate the larger between two common fractions; (B) cross-format comparisons: participants should indicate the larger between a line ratio and a common fraction; and (C) nonsymbolic ratio comparisons: participants should indicate the larger between two-line ratios.
Present study
In this study, we investigated the effects of MA on math achievement in general, and on fractions performance in particular, across development. We tested two groups of participants: children at the beginning of elementary school, who have not yet received extensive formal instruction with fractions (2nd and 3rd graders; roughly 7–9 years old), and in more advanced grades after formal fractions instruction (5th and 6th graders, roughly 10–12 years old). They completed a general MA questionnaire, a WM measure, and tasks assessing different fraction domains, including FK and nonsymbolic ratio, symbolic fraction, and cross-format (nonsymbolic ratio versus symbolic fraction) comparisons. We also investigated the MA effects on general math achievement as a control, including a fluency task and a written calculation task, given the extensive body of the literature showing such association.3,5–7 We expected higher MA to be associated with lower performance in all investigated mathematics domains, especially fractions. However, considering that the RPS may be efficient and demand fewer WM resources than symbolic fraction skills, we predicted that we would observe a stronger association between MA and symbolic fraction comparisons and FK than between MA and nonsymbolic ratio comparisons. Furthermore, for general math achievement, we expected stronger MA effects on the written calculation task, which may be more demanding, than in the fluency task, which may be solved by retrieval. Finally, since MA may impact mathematics achievement via WM overload, we predicted that the association between MA and performance in our mathematics tasks might be no longer significant after controlling for participants’ WM.
Methods
Participants
A total of 273 children composed our initial sample. One participant received the diagnosis of autism spectrum disorder after data collection was completed and was excluded from our analyses. Thus, the final sample was composed of 272 participants, combined in two groups: younger participants (2nd and 3rd graders; N = 140, 57% male, mean age = 7.99, SD = 0.48 years), and older participants (5th and 6th graders; N = 132, 59% male, mean age = 10.96, SD = 0.71 years). Groups did not differ by gender, χ2(1) = 0.02, P = 0.90. Participants were predominantly from a middle-class background, non-Hispanic (75% non-Hispanic, 10% Hispanic, and 15% not reported), and White (72% White, 2% Asian, 3% Black or African-American, 9% more than one race, and 14% not reported).
Overall procedure
Participants were recruited during two waves of enrollment as part of an ongoing longitudinal study, which investigates how children develop nonsymbolic ratio and symbolic fraction skills. Data from participants from the second enrollment wave, who were in their first year in the longitudinal study (2nd and 5th graders), and data from participants from the first enrollment wave, who were in their second year in the longitudinal study (3rd and 6th graders), were included in this study. All participants came to our lab to complete two individual sessions for every year of participation. The first session consisted of standardized measures, including tests assessing general mathematics achievement and WM. Our second session consisted of non-standardized measures, including the assessment of MA, FK, and nonsymbolic ratio and symbolic fraction processing. We used different forms of the standardized tests and fraction knowledge assessment (FKA) in the first (2nd and 5th grade) and second (3rd and 6th grade) year of our study to avoid high familiarity with our measures. All participants received $10 as compensation for every 1h completed in the study. Participants from 2nd to 5th grade also received a small toy.
Materials
Math anxiety
As a measure of MA, we used the Math Anxiety Rating Scale-Elementary Form (MARS-E).51 This questionnaire consists of 26 items designed to assess how nervous the participant would feel in various everyday life situations involving math. Participants were presented with a print questionnaire, and the examiners offered to read them the sentences. Participants marked their responses for each question on a five-point Likert scale, ranging from “Not at all nervous” (i.e., 1 point) to “Very, very nervous” (i.e., 5 points), with a maximum score of 130 possible points.
Working memory
We used two different tests to measure verbal WM. Children who were in 2nd and 5th grade (i.e., the first year of the longitudinal study) completed the Auditory Working Memory subtest from the Woodcock–Johnson Tests of Cognitive Abilities III.52 Children who were in 3rd and 6th grade (i.e., the second year of the longitudinal study) completed the backwards Digit Span (bDS) subtest from the Wechsler Intelligence Scale for Children IV.53 In both tests, stimuli were presented as audio files from a laptop speaker to minimize experimenter bias. In our analysis, we have created a composite score by z-transforming participants’ raw scores in these tests and combining them for each group (i.e., younger and older participants).
Auditory working memory.
In the auditory working memory (AWM) test, participants listened to a sequence of nouns and digits and were instructed to reorder the stimuli and repeat the presented nouns followed by the digits (e.g., if participants listened to “2 - dog”, the correct answer would be “dog - 2”). In AWM, participants need to hold and manipulate the information in their WM by remembering the stimuli and arranging them in the correct order. For each item, the score ranged from 0 to 2, and the maximum total score in this task was 42. Standardized scores were calculated according to the tests’ norms.
Backwards digit span.
In the bDS test, participants listened to a sequence of digits and were instructed to repeat them backwards (e.g., if participants listened to “2 – 7 – 4”, the correct answer would be “4 – 7 - 2”). Two sequences of digits were given for each trial, with increasing complexity between trials. In this test, similar to AWM, participants need to hold and manipulate information in their WM by remembering the stimuli and organizing them in the correct order. For each item, the score ranged from 0 to 2, and the maximum total score in this task was 16. Standardized scores were calculated according to the tests’ norms.
General mathematics achievement
We investigated children’s MF and written calculation skills using standardized math achievement tests.
Math fluency.
As a measure of fluency in solving arithmetic problems, participants completed the math fluency (WJ-MF) subtest of the Woodcock–Johnson® Test of Achievement III (WJ III).54 Participants were presented with 160 simple calculation problems, including addition, subtraction, and multiplication. Participants had a time limit of 3 min to complete the test, and one point was given for each correct answer.
Written calculation.
Participants completed the calculation (WJ-Calc) subtest of the WJ III54 to measure their written calculation skills. Participants were presented with 45 problems of increasing complexity, from basic addition to trigonometry. Participants had no time limit to complete the test, and one point was given for each correct answer.
Fraction knowledge
Participants’ FK was assessed with the version of the FKA that corresponded with their grade. We constructed the FKA by combining items from previous research papers and national exams.55,56 This task was composed of items assessing conceptual FK (e.g., “How many possible fractions are between and ?”) and operations with fractions (e.g., “”). Participants were not given a time limit to complete this paper and pencil task, and 1 point was given for each correct answer. The percentage of correct answers for each grade was used in the analyses.
Ratio comparisons
Participants’ ratio processing skills were assessed by the Cross-Format Fraction Comparison task (Fig. 1).48 In this task, participants were presented with two ratios, one on the left side and another on the right side of a computer screen and instructed to identify the larger ratio by pressing the corresponding button on the keyboard: “J” with their index finger, if the ratio on the left was larger, and “K” with their middle finger, if the ratio on the right was larger. There were 108 trials in total, split into three blocks. Ratios were presented in three different formats: nonsymbolic (i.e., the RPS index), cross-format (nonsymbolic ratio versus symbolic fraction), and symbolic (i.e., the symbolic fraction processing index). In the nonsymbolic condition, participants compared two line-ratios. In the cross-format condition, participants compared a line ratio with a symbolic common fraction. Finally, in the symbolic condition, participants compared two symbolic common fractions. In this task, the presentation frequency, numerical distance, and congruency of the fraction components were experimentally manipulated. The symbolic fractions included all possible irreducible single-digit fractions (for details, see Ref. 46), and the nonsymbolic ratios corresponded to the magnitude of the symbolic fractions. Conditions were presented intermixed within each block, with a total of 36 trials for each condition. We presented experimental stimuli using E-Prime® 2.0.8.90a (Psychology Software Tools, Sharpsburg, PA) on Dell Latitude E7470 laptops (Windows 10 64-bit OS, Intel i5 2.40 GHz, 8 GB RA.
We trimmed responses in this task by reaction time (RT) at the participant level. Trials with a reaction time less than 200 ms or with an RT under or above 2 standard deviations from the participant’s mean RT were excluded. Furthermore, data from participants with total accuracy under 60% (seven younger and four older participants) were excluded from the analyses with this task. In our analysis, we have used the inverse efficiency score (IES; i.e., mean RT/mean accuracy), which accounts for speed-accuracy trade-offs and differences across cohorts. A lower IES indicates better performance. Developmentally, accuracy may be more sensitive to magnitude comparison skills of children in early grades, whereas RT may be more sensitive to the skills of children in more advanced grades.57 However, since the analysis of the IES alone can lead to a biased interpretation of results due to increased variability in the data,58 we also analyzed mean accuracy and the mean RT of the correct trials separately. Accuracy and RT analyses are presented in the Supplementary Materials (online only).
Results
In our analysis, we first compared data from younger and older participants. Then, we ran zero-order correlations between our measures, and conducted a series of regression models. In the regression models, we entered MA and WM as predictors and MF, written calculation, FK, and nonsymbolic ratio, cross-format, and symbolic fraction comparisons as outcome measures. Finally, we conducted mixed-effects ANOVA to explore the differential effects of MA on nonsymbolic ratio comparisons and symbolic fraction comparisons.
Since the effects of MA on math achievement can differ across genders,59 we first compared the raw scores of male and female across younger and older participants (see Tables S1 and S2, online only). The self-reported levels of MA were not significantly different between males and females, both in younger participants, (t(138) = 1.47, P = 0.15; d = 0.25), and in older participants, (t(130) = 1.61, P = 0.11; d = 0.29.) We also conducted the main regression models including gender as a factor. However, we did not find robust effects of gender: we only observed borderline gender and MA interactions on two tasks (significant effects shown in Tables S3 and S4, online only). Therefore, we conducted all subsequent analyses without gender as a covariate.
Cross-sectional analysis
We compared the performance of younger and older participants in our measures using t-tests and Bonferroni correction for multiple comparisons. These results are shown in detail in Table S5 (online only). In line with a predicted improvement in performance with development, older participants had higher scores than younger participants in MF, calculation, and nonsymbolic ratio, cross-format and symbolic fraction comparisons (all P < 0.001). We also explored participants’ performance in FK (FKA) and WM (AWM and bDS). Participants in both groups performed above 50% of correct answers in FKA. Since we used different forms of the FKA across grades with more difficult problems for higher grades, this between-grades comparison was exploratory. Older participants had a higher score than younger participants, (t(270) = 3.38, P < 0.05; d = 0.41), suggesting developmental improvements. Overall, participants had average to high standardized scores in our WM measures. We have not directly compared the groups’ WM since in our further analyses we used a combined measure (z-transformed), which was calculated separately for each group. In contrast with results for mathematics skills and WM and diverging from previous studies,9,31,60 the self-reported levels of MA were not significantly different between younger (mean MARS-E score = 57.51, SD = 19.37) and older participants (mean MARS-E score = 53.99, SD = 17.65), t(270) = 1.56, P = 0.120, d = 0.19).
Associations between MA and different mathematics skills
The significant associations between MA and our outcome measures are shown in Figure 2. In line with our predictions, higher MA was associated with lower performance in MF (WJ-MF), written calculation (WJ-Calc), FK (FKA), and symbolic fraction comparisons (i.e., higher IES) for both younger and older participants. However, there was no significant association between MA and nonsymbolic ratio and cross-format comparisons. The full correlation matrix for younger and older participants is presented in Tables S6 and S7 (online only). We contrasted the correlation coefficients between younger and older participants, and they were not significantly different (all P > 0.30). Furthermore, there was no significant difference in the correlation coefficients across tasks within younger participants (all P > 0.17). Within older participants, there was no significant difference in the associations between MA and WJ-MF, FKA, and symbolic fraction comparison (all P > 0.46). Critically, the relationship between MA and WJ-Calc was significantly stronger than between MA and WJ-MF (z = 2.38, P = 0.02), FKA (z = 2.10, P = 0.04), and symbolic fraction comparison (z = 2.43, P = 0.02).
Figure 2.
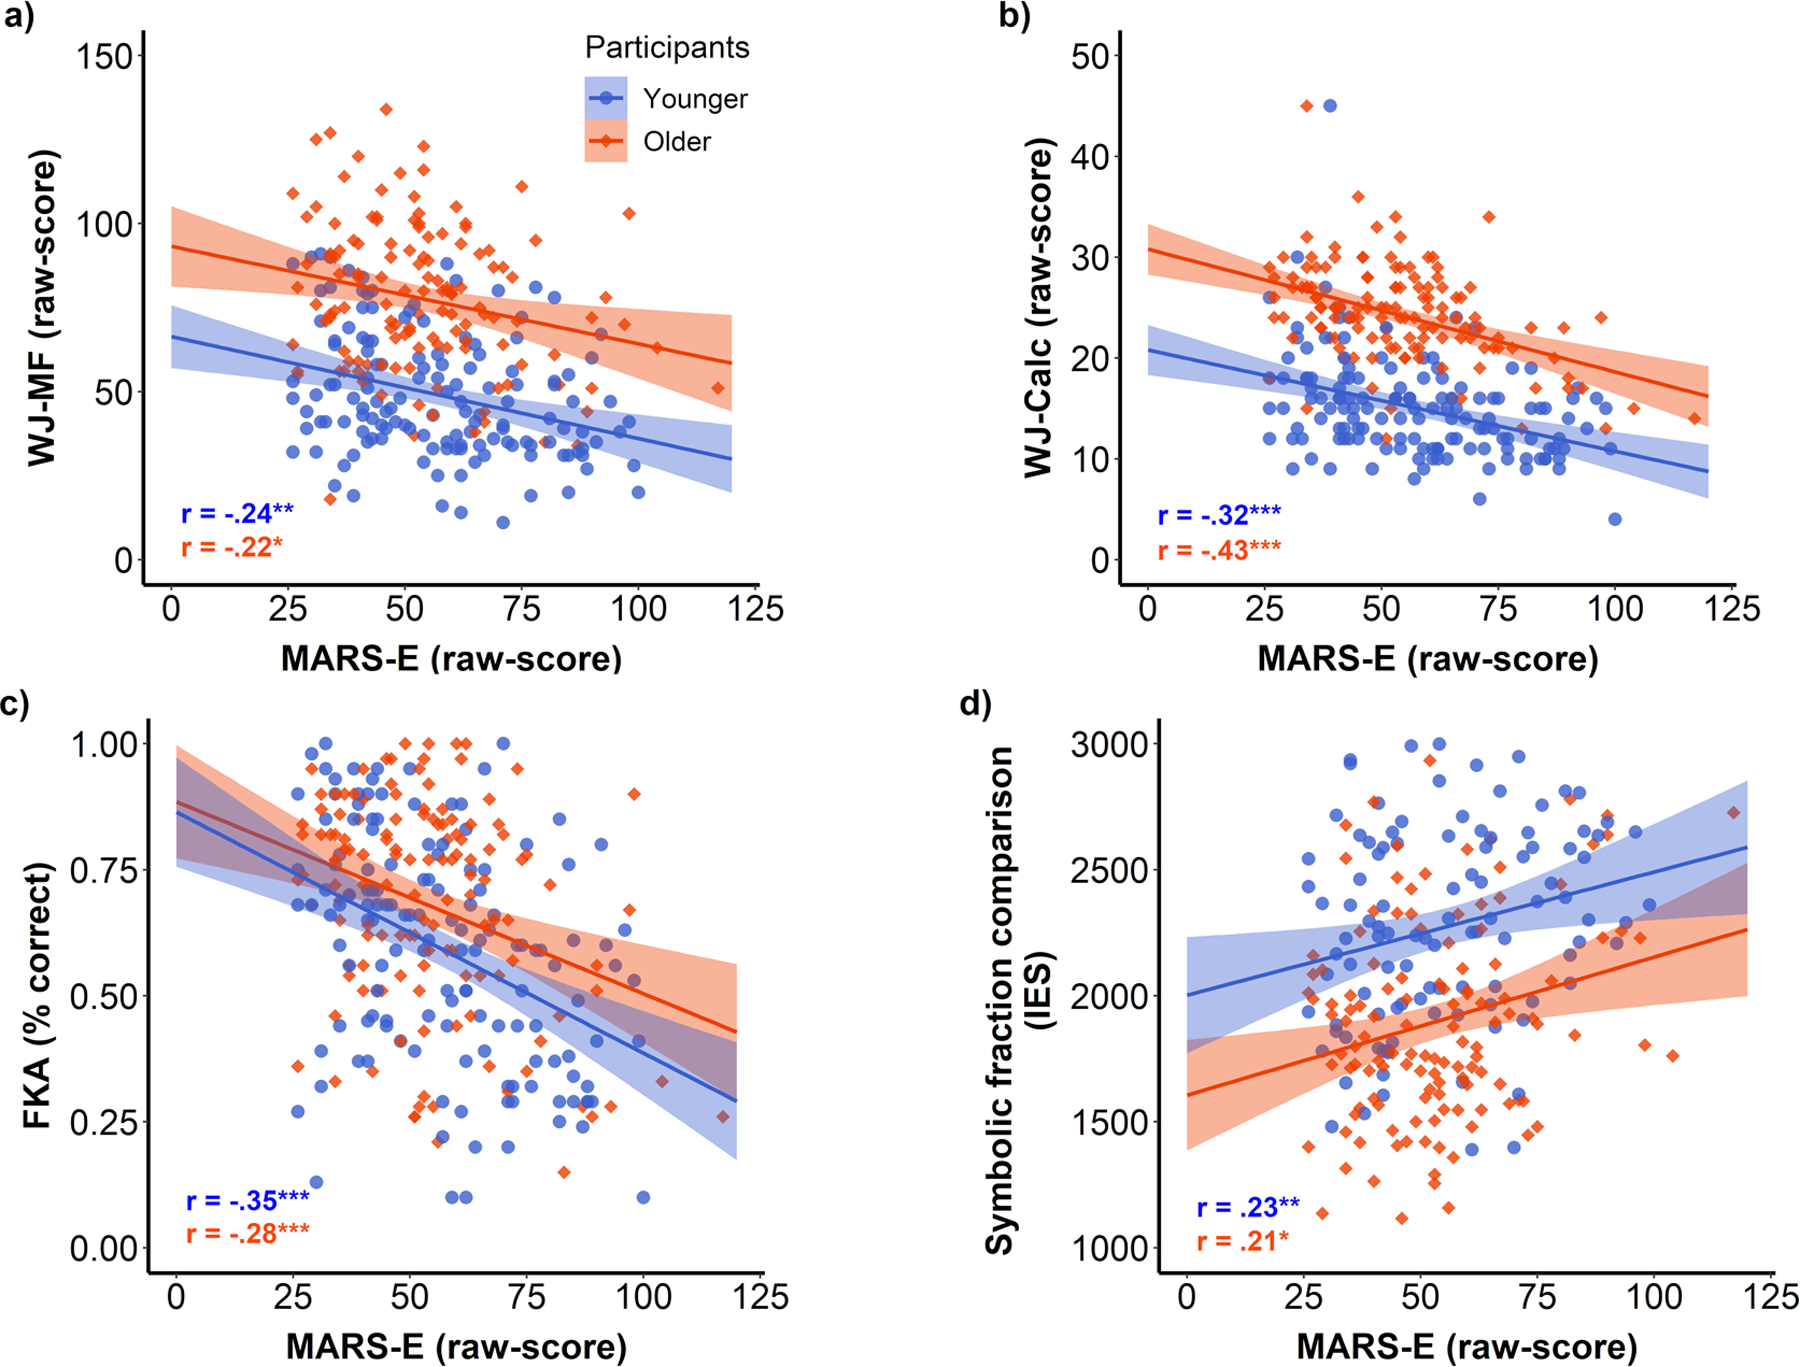
The association between MA (MARS-E) and (A) math fluency (WJ-MF), (B) written calculation (WJ-Calc), (C) fraction knowledge (FKA), and (D) symbolic fraction comparisons by group. Blue dots represent younger participants and orange diamonds represent older participants. * P < 0.05, ** P < 0.01, and *** P < 0.001.
We further investigated our hypothesis that the effects of MA on general math achievement and fraction performance are associated with WM by conducting a series of regression models. Using standardized scores, we conducted separate regressions models for each of our outcome variables: MF (WJ-MF), written calculation (WJ-Calc), FK (FKA), and nonsymbolic ratio, cross-format, and symbolic fraction comparisons. We entered age (in years) and MA in a first step and WM and the interaction term between MA and WM in a second step. In the following paragraphs, we present results for outcome variables significantly associated with MA. Regression models for nonsymbolic ratio and cross-format comparisons corroborated results from the correlation analyses and are presented in Tables S8–S13 (online only).
Math fluency.
The results of the regression models for WJ-MF are summarized in Table 1. For younger participants, higher WJ-MF scores were associated with increased age and lower MA. The model with age and MA as predictors explained 10% of WJ-MF variance. When WM was included in this model, the explained variance increased to 19%. Higher WM was significantly associated with higher WJ-MF scores. However, in the full model, the association between MA and WJ-MF was no longer significant. There was no significant interaction between MA and WM. For older participants, higher WJ-MF was associated with lower MA but not significantly associated with age. The model with age and MA as predictors explained 4% of WJ-MF variance. After WM was included in this model, the WJ-MF explained variance increased to 18%. There was a significant positive association between WM and WJ-MF. However, MA was no longer a significant predictor of WJ-MF. Finally, there was no significant interaction between MA and WM.
Table 1.
Regression models for math fluency (WJ-MF)
| Predictor | Model 1 |
Model 2 |
||||||
|---|---|---|---|---|---|---|---|---|
| β | SE | t | P | β | SE | t | P | |
| Younger participants | ||||||||
| Age | 0.47 | 0.17 | 2.79 | <0.01 | 0.35 | 0.17 | 2.11 | <0.05 |
| MA | −0.21 | 0.08 | −2.61 | <0.01 | −0.13 | 0.08 | −1.68 | 0.10 |
| WM | 0.34 | 0.08 | 4.22 | <0.001 | ||||
| MA*WM | −0.09 | 0.07 | −1.31 | 0.19 | ||||
|
| ||||||||
| Adjusted R2 | 0.10 | |||||||
| Δ Adjusted R2 | F(2,135) = 9.24*** | 0.09 | |||||||
|
| ||||||||
| Older participants | ||||||||
| Age | 0.05 | 0.12 | 0.38 | 0.70 | 0.05 | 0.11 | 0.46 | 0.65 |
| MA | −0.22 | 0.09 | −2.59 | <0.05 | −0.14 | 0.09 | −1.66 | 0.10 |
| WM | 0.40 | 0.08 | 4.91 | <0.001 | ||||
| MA*WM | −0.02 | 0.08 | −0.25 | 0.81 | ||||
|
| ||||||||
| Adjusted R2 | 0.04 | |||||||
| Δ Adjusted R2 | F(2,127) = 12.12*** | 0.14 | |||||||
Note: MA, math anxiety; WM, working memory.
Written calculation.
The results of the regression models for WJ-Calc are summarized in Table 2. For younger participants, higher WJ-Calc scores were associated with increased age and lower MA. The model with age and MA as predictors explained 12% of WJ-Calc variance. When WM was included in this model, the explained variance increased to 21%. Higher WM was significantly associated with higher WJ-Calc scores. In this full model, the association between MA and WJ-Calc remained significant, and there was no significant interaction between MA and WM. For older participants, higher WJ-Calc scores were associated with lower MA but not significantly associated with age. The model with age and MA as predictors explained 17% of WJ-Calc variance. After WM was included in this model, the WJ-Calc explained variance increased to 28%. There was a significant positive association between WM and WJ-Calc. In this model, MA remained a significant predictor of WJ-Calc. Finally, there was no significant interaction between MA and WM.
Table 2.
Regression models for written calculation (WJ-Calc)
| Predictor | Model 1 |
Model 2 |
||||||
|---|---|---|---|---|---|---|---|---|
| β | SE | P | P | β | SE | t | P | |
| Younger participants | ||||||||
| Age | 0.36 | 0.17 | 2.17 | <0.05 | 0.33 | 0.16 | 1.99 | <0.05 |
| MA | −0.29 | 0.08 | −3.64 | <0.001 | −0.21 | 0.08 | −2.69 | <0.01 |
| WM | 0.31 | 0.08 | 3.84 | <0.001 | ||||
| MA*WM | 0.08 | 0.07 | 1.12 | 0.27 | ||||
|
| ||||||||
| Adjusted R2 | 0.12 | |||||||
| Δ Adjusted R2 | F(2,135) = 8.63*** | 0.09 | |||||||
|
| ||||||||
| Older participants | ||||||||
| Age | 0.05 | 0.11 | 0.48 | 0.63 | 0.06 | 0.10 | 0.53 | 0.59 |
| MA | −0.43 | 0.08 | −5.37 | <0.001 | −0.36 | 0.08 | −4.47 | <0.001 |
| WM | 0.35 | 0.08 | 4.68 | <0.001 | ||||
| MA*WM | −0.03 | 0.07 | −0.37 | 0.71 | ||||
|
| ||||||||
| Adjusted R2 | 0.17 | |||||||
| Δ Adjusted R2 | F(2,127) = 11.05*** | 0.11 | |||||||
Note: MA, math anxiety; WM, working memory.
Fraction knowledge.
The results of the regression models for FKA are summarized in Table 3. For younger participants, the diagnostic analysis indicated the presence of one influential case, which was excluded from the model presented here. Higher FKA scores were associated with increased age and lower MA. The model with age and MA as predictors explained 17% of FKA variance. When WM was included in this model, the explained variance increased to 29%. In this full model, higher WM was significantly associated with higher FKA scores. Critically, the association between MA and FKA remained significant, and there was no significant interaction between MA and WM. However, FKA was no longer significantly associated with age. For older participants, higher FKA scores were associated with lower MA but not significantly associated with age. The model with age and MA as predictors explained 7% of FKA variance. After WM was included in this model, the FKA explained variance increased to 27%. There was a significant positive association between WM and FKA and no significant interaction between MA and WM. In contrast with the younger participants’ model, MA was no longer a significant FKA predictor when controlling for WM.
Table 3.
Regression models for fraction knowledge (FKA)
| Predictor | Model 1 |
Model 2 |
||||||
|---|---|---|---|---|---|---|---|---|
| β | SE | t | P | β | SE | t | P | |
| Younger participants | ||||||||
| Age | 0.35 | 0.16 | 2.21 | <0.05 | 0.26 | 0.15 | 1.72 | 0.09 |
| MA | −0.36 | 0.08 | −4.70 | <0.001 | −0.28 | 0.07 | −3.79 | <0.01 |
| WM | 0.38 | 0.08 | 4.86 | <0.01 | ||||
| MA*WM | −0.01 | 0.07 | −0.19 | 0.85 | ||||
|
| ||||||||
| Adjusted R2 | 0.17 | |||||||
| Δ Adjusted R2 | F(2,134) = 12.17*** | 0.12 | |||||||
|
| ||||||||
| Older participants | ||||||||
| Age | −0.10 | 0.12 | −0.86 | 0.39 | −0.07 | 0.11 | −0.70 | 0.49 |
| MA | −0.28 | 0.08 | −3.36 | <0.01 | −0.16 | 0.08 | −1.93 | 0.06 |
| WM | 0.46 | 0.08 | 6.08 | <0.001 | ||||
| MA*WM | 0.07 | 0.07 | 0.95 | 0.34 | ||||
|
| ||||||||
| Adjusted R2 | 0.07 | |||||||
| Δ Adjusted R2 | F(2,127) = 18.82*** | 0.20 | |||||||
Note: MA, math anxiety; WM, working memory.
Symbolic fraction comparisons (IES).
The results of the regression models for symbolic fraction comparisons are summarized in Table 4. For younger participants, our models’ diagnostic analysis indicated the presence of one influential case, which was excluded from our final model. There was no significant association between symbolic fraction comparisons and MA or age. The model with age and MA as predictors explained 3% of the symbolic fraction comparisons variance. After WM was included in this model, the symbolic fraction comparisons explained variance increased to 13%. In the full model, higher WM was associated with better performance in symbolic fraction comparisons, and there was a significant interaction between WM and MA. We explored this interaction by investigating the MA slopes after holding WM scores constant at different values, from low (−2.8) to high (3.2). As illustrated in Figure 3, the effects of MA on symbolic fraction comparisons were more pronounced for participants with lower than higher WM. In contrast with results with the IES, higher MA was associated with lower accuracy in symbolic fraction comparisons when controlling for WM, and there was no significant interaction between MA and WM (see Table S14, online only). There was no significant association between symbolic fraction comparisons RT and MA.
Table 4.
Regression models for symbolic fraction comparisons (IES)
| Predictor | Model 1 |
Model 2 |
||||||
|---|---|---|---|---|---|---|---|---|
| β | SE | t | P | β | SE | t | P | |
| Younger participants | ||||||||
| Age | −0.28 | 0.17 | −1.66 | 0.10 | −0.31 | 0.16 | −1.89 | 0.06 |
| MA | 0.14 | 0.08 | 1.64 | 0.10 | 0.05 | 0.08 | 0.65 | 0.52 |
| WM | −0.29 | 0.08 | −3.45 | <0.001 | ||||
| MA*WM | −0.22 | 0.09 | −2.47 | <0.05 | ||||
|
| ||||||||
| Adjusted R2 | 0.03 | |||||||
| Δ Adjusted R2 | F(2,127) = 7.97*** | 0.10 | |||||||
|
| ||||||||
| Older participants | ||||||||
| Age | −0.10 | 0.12 | −0.82 | 0.42 | −0.13 | 0.12 | −1.14 | 0.26 |
| MA | 0.21 | 0.09 | 2.48 | <0.05 | 0.11 | 0.09 | 1.22 | 0.22 |
| WM | −0.32 | 0.08 | −3.77 | <0.001 | ||||
| MA*WM | −0.09 | 0.08 | −1.12 | 0.27 | ||||
|
| ||||||||
| Adjusted R2 | 0.04 | |||||||
| Δ Adjusted R2 | F(2,123) = 7.70*** | 0.09 | |||||||
Note: MA, math anxiety; WM, working memory.
Figure 3.
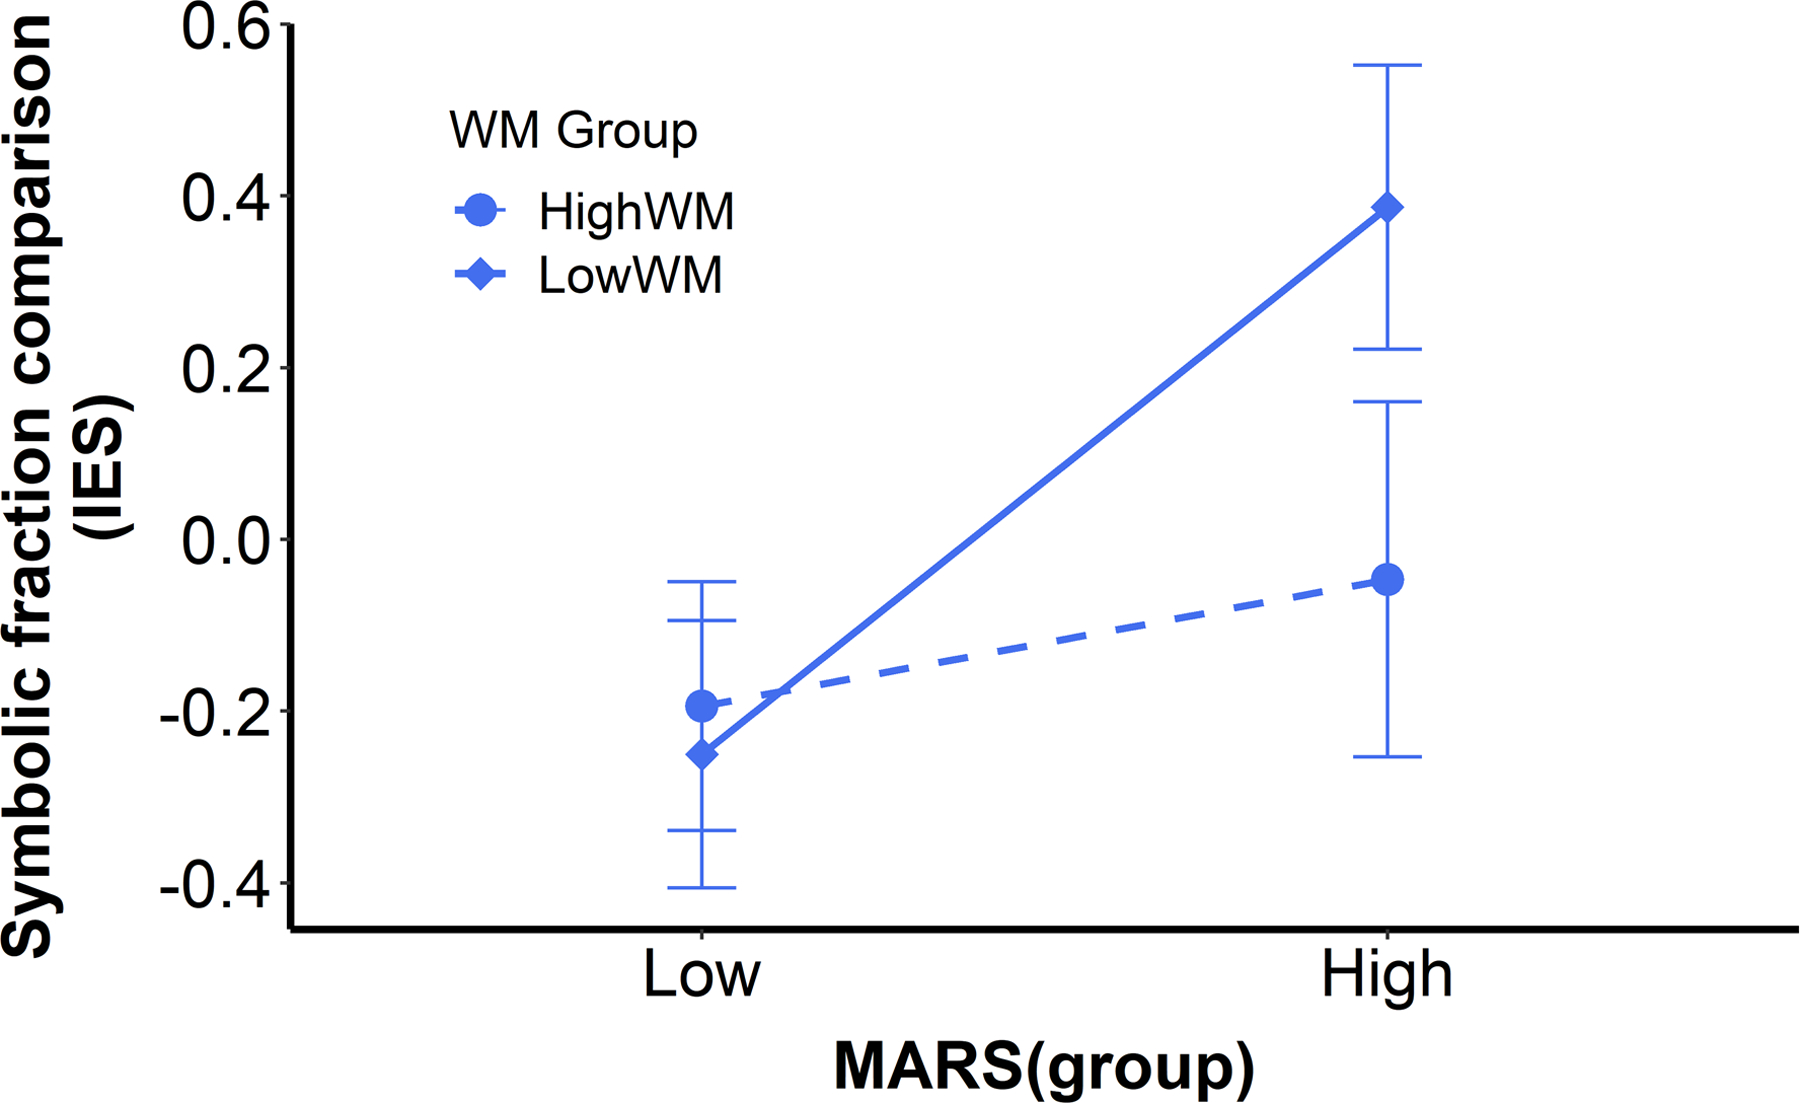
The interaction between MA (MARS-E) and working memory (WM) on symbolic fraction comparisons in younger participants. Analyses were conducted with continuous data, but we plotted categorical data for better visualization. As MA increased, its effects on symbolic fraction comparisons became stronger for children with lower WM. MARS-E, Math Anxiety Rating Scale-Elementary form.
For older participants, better performance in symbolic fraction comparisons was associated with higher MA but not significantly associated with age. The model with age and MA as predictors explained 4% of the symbolic fraction comparisons variance. After WM was included in this model, the explained symbolic fraction comparisons variance increased to 13%. In this full model, higher WM was associated with better symbolic fraction comparisons performance. However, the association between MA and symbolic fraction comparisons was no longer significant. Finally, there was no interaction between WM and MA. In contrast with results with the IES, when symbolic fraction comparisons were indexed by accuracy, there was a significant interaction between MA and WM (see Table S15, online only). Overall, the effects of MA on performance were more robust for participants with lower WM. There was no significant association between symbolic fraction comparisons RT and MA.
MA effects on nonsymbolic ratios and symbolic fractions
Results from our correlation and regression analysis suggested a differential effect of MA on nonsymbolic ratio and symbolic fraction comparisons. While participants with higher MA had worse performance in symbolic fraction comparisons, there was no significant association between MA and performance in nonsymbolic ratio comparisons. To directly test this pattern, we conducted 2 × 2 mixed-effects ANOVA, entering the IES as a dependent variable, and the extreme comparison formats (two within-subjects levels: nonsymbolic ratio and symbolic fraction) and MA level (two between-subjects levels: median-split high and low MA) as independent variables.
Results are presented in Figure 4. Younger participants’ results indicated significant main effects of format, (F(1,131) = 8.29, P < 0.01, η2 = 0.39, and the MA level, F(1,131) = 239.95, P < 0.001, η2 = 0.04), and a significant MA by format interaction, (F(1,131) = 4.26, P < 0.05, η2 = 0.01). Bonferroni-corrected post-hoc analyses indicated better performance in nonsymbolic ratio than symbolic fraction comparisons (P < 0.001) and better performance of participants with lower than higher MA (P < 0.05). Finally, participants with low and high MA significantly differed in symbolic fraction comparisons (P < 0.01), and marginally but non-significantly differed in nonsymbolic ratio comparisons (P = 0.06). Older participants’ results indicated a significant main effect of format, (F(1,126) = 212.05, P < 0.001, η2 = 0.27; see results from 46, which also analyzed data extracted from our current longitudinal investigation). Bonferroni-corrected post-hoc analyses indicated better performance in nonsymbolic ratio than symbolic fraction comparisons (P < 0.001). There was no significant main effect of the MA level, (F(1,126) = 0.58, P = 0.45, η2 = 0.004), and no significant MA level by format interaction, (F(1,126) = 2.18, P = 0.14, η2 = 0.004).
Figure 4.

The inverse efficiency score (IES) in nonsymbolic ratio comparisons and symbolic fraction comparisons by low and high MA levels in younger (A) and older (B) participants.
Discussion
Recent studies have shown that high MA is associated with low performance in symbolic fraction tasks in adults.34,35 However, the effects of MA on children’s fraction skills have been largely underexplored. In this study, we started to address this gap by investigating the association between MA and general math achievement and fraction skills in younger (2nd and 3rd graders) and older (5th and 6th graders) children. Our results indicated that MA differentially impacts general math achievement, FK, and symbolic fraction and nonsymbolic ratio processing across development. The effects of MA were more accentuated on participants’ general mathematics performance, FK, and symbolic fraction skills than their nonsymbolic ratio skills. Furthermore, our results suggest that the effects of MA on participants’ performance occur directly and indirectly via WM, depending on participants’ grade and the nature of the mathematics task. These results may contribute to our understanding of how MA affects distinct mathematics skills.
MA across grades
MA can start as early as the first grades of elementary school.6,31,60–62 In our study, we observed signs of MA even in our participants in 2nd and 3rd grade. However, contrary to studies indicating that MA increases with age and education,9,31,60,63 we observed no differences in the levels of self-reported MA between our younger and older participants. Since we have not yet analyzed data from these participants longitudinally, this pattern could be due to cohort effects. Another possibility is that a substantial increase in MA occurs during adolescence, in more advanced grades that were not investigated in our current study. Dowker and colleagues2 have suggested that MA increases significantly during adolescence when students are presented with more advanced math concepts in schools and become more self-aware of social comparison and more vulnerable to stereotype threats.
MA effects on general math achievement
Higher MA has been associated with lower math achievement in children.6,7,39 Corroborating these previous findings, our participants with higher MA had lower performance in our measures of general math achievement, including MF and written calculation. We predicted stronger effects of MA on written calculation—which can be more cognitively demanding—than MF. Corroborating our predictions, MA was more strongly associated with written calculation than MF among older participants, but not among younger participants.
Our MF measure was timed and comprised basic whole-number arithmetic, whereas our written calculation measure was untimed but comprised more complex operations with positive and negative whole numbers, fractions, percentages, and decimals. It is possible that the effects of MA on MF among younger participants were explained by time pressure, corroborating previous studies.64,65 However, if time pressure uniquely explained the effects of MA on MF, we should also observe an effect among older participants, which was not the case. Therefore, the effects of MA on performance may also be explained by participants’ strategies. Since younger participants were still acquiring basic mathematics knowledge, they may have relied on WM demanding strategies to solve both the MF and the written calculation measures. In contrast, older participants may have already mastered basic arithmetic and, therefore, solved the MF task by using retrieval strategies. Alternatively, they may have performed online calculations to solve the complex problems from our written calculation measure, which may be more cognitively demanding.39,66–68 Therefore, the effects of MA may be stronger in written calculation—despite this task being untimed—than MF owing to WM exhaustion resulting from the strategy older participants applied to solve these tasks.
Differential associations between MA and nonsymbolic ratio and symbolic fraction processing
Recent studies have suggested that the difficulties associated with fractions may be exacerbated by MA. Rayner and colleagues34 have found that preservice teachers with high MA had worse performance in a conceptual FK task than their peers with low MA. Additionally, Sidney and colleagues35 have shown that MA may impair even basic fraction processing, as assessed by a symbolic fraction comparison task and a fraction number line task. Corroborating and expanding upon these studies, we observed that higher MA was associated with lower performance in FK and symbolic fraction comparisons in both younger and older participants. Conversely, we observed no significant association between MA and performance in a nonsymbolic ratio comparison task or a cross-format comparison task.
Our results suggest that MA has stronger effects on symbolic fraction skills than nonsymbolic ratio skills. To solve both nonsymbolic ratio comparisons and cross-format comparisons, participants may rely on an analog, nonsymbolic ratio magnitude code, which is processed by the RPS, instead of converting the nonsymbolic ratios to a symbolic fraction code.48 Recently, studies have shown that children can compare nonsymbolic ratios with high accuracy even before they are introduced to fractions in schools, suggesting that the RPS is an intuitive system that develops early.48,49 Furthermore, Matthews and Lewis50 have shown that nonsymbolic ratio magnitudes interfere with symbolic fraction processing, suggesting that the abilities supported by the RPS are highly efficient. Therefore, when solving nonsymbolic ratio and cross-format comparison tasks, children may not demand high WM resources, mitigating the MA effects. In contrast, they may demand higher cognitive resources when working with symbolic fractions33, exacerbating the MA effects. Similar results have been previously found for absolute magnitudes. In both children and adults, no significant association has been observed between the nonsymbolic absolute magnitude comparisons—which are highly efficient—and MA.12,45–47 In summary, these results indicate that nonsymbolic magnitude processing may be more resistant to MA effects.
MA effects on math performance via WM
Our results indicate that MA affects MF and symbolic fraction skills directly and indirectly via WM. However, for symbolic fraction skills, these effects depend on participants’ age and their extent of formal experiences with fractions in schools. More specifically, for FK, we observed that its association with MA remained significant after controlling for WM in younger participants but was no longer significant in older participants. For symbolic fraction comparisons, we observed a significant interaction between MA and WM in our younger participants when we investigated the IES, and in our older participants when we investigated accuracy (see Table S14, online only). In our sample, the effects of MA on symbolic fraction comparisons were more pronounced for children with lower WM capacity than children with higher WM capacity.
In general, our results are consistent with theories that propose that MA impairs math achievement by overloading WM.3,13 Specifically, children with higher anxiety may have intrusive thoughts when solving mathematics tasks, leaving them with lower WM resources available, which then undermines their math performance.3,37 However, the direct effects of MA on FK may be explained by an alternative theory69 that suggests that MA results from an impairment in basic numerical skills. As proposed by Maloney and colleagues,69 the poor understanding of numerical magnitudes can lead to low math achievement. With development, low math achievement could lead to high MA, generating ruminations, and then overloading WM. Finally, the overload in WM could impair math achievement and promote more MA, establishing a vicious cycle.43 This could be the case for our participants’ FK. Some of our participants may have experienced difficulties when acquiring conceptual and procedural FK in early grades, leading to higher MA and a WM overload in advanced grades. A better understanding of the mechanism through which MA is associated with FK may be possible in the future years of our ongoing longitudinal investigation with the participants who composed our sample.
While many studies have consistently reported that higher MA is associated with WM overload, there is still an unsolved debate about the groups that are most impacted by this association. Some studies have suggested that MA is more detrimental for participants with lower WM capacity.5,70 Contrary to this view, other studies have suggested that MA is more detrimental for participants with higher WM capacity, who tend to use more demanding strategies to solve mathematics problems.38,71 In the present study, we observed stronger MA effects on symbolic fraction comparisons in participants with lower WM capacity, in particular among younger participants. However, it is important to notice that our participants may not represent the general population since they had average to high WM, as measured by standardized tasks.
The effects of MA and WM on symbolic fraction comparisons may also be explained by the strategies participants engaged in with this task. Recently, our research group has shown that besides comparing the holistic magnitude of symbolic fractions, children also rely on componential strategies (e.g., identifying the fraction with a smaller difference between the numerator and the denominator as the larger or identifying the fraction with a larger numerator as the larger, regardless of the denominator magnitude).48 Focusing on the holistic magnitude of fractions demands more cognitive resources than using componential strategies in comparison tasks.33 If our participants used holistic strategies, they may have overloaded their WM and, consequently, exacerbated the effects of MA. While this hypothesis is plausible, in a recent study with adults, Sidney and colleagues18 did not find strong evidence that strategies used in a symbolic fraction comparison task mediate the effects of MA. The strategies used by children when comparing symbolic fractions may be an important piece to understanding the direct and indirect effects of MA on performance, which should be explored in future studies.
Limitations and future directions
Our study did not find a link between MA and nonsymbolic ratio processing, using a nonsymbolic comparison task with ratios presented as two lines parallel to each other. However, it is possible that such an association would be revealed using a different task. For example, nonsymbolic ratio processing has been assessed by more cognitive tasks, such as number line tasks72 and estimation tasks.73 Furthermore, nonsymbolic ratios have been presented not only as lines but also as dot arrays, pies, and rectangles, which can either appear separated or integrated.22,73,74 Arguing against the importance of such low-level differences, Park and colleagues46 have observed that different ratio comparison tasks, which used either separate or integrated dots or lines as stimuli, measure a similar construct. Because of time constraints (our study already involved two 60–90-min testing sessions with children), we chose to examine nonsymbolic ratio processing with only one stimulus format, but examination of other formats and their association with MA should be a target of future investigations.
Other potential limitations from this study could be our MA and WM measures. Recent studies have suggested that our MA measure, the MARS-E,51 may have low specificity, assessing test anxiety instead of MA.75,76 We chose this measure because it is easy to administer to children and well-established for permitting comparisons with previous MA studies.2,76 Future studies should examine whether the RPS is more resistant to MA, specifically, or to general test anxiety. Furthermore, in the current study, we focused on verbal WM. However, it is possible that the nonsymbolic magnitude processing recruits higher visuospatial than verbal WM resources.77 Therefore, future studies should investigate whether MA is associated with the RPS via visuospatial WM.
Finally, our study found differential effects of MA on general mathematics and fraction tasks. We have suggested that because our participants were still acquiring FK, this mathematics domain was more cognitively demanding to them and, thus, exacerbated MA effects on their performance. However, it is also possible that specific conceptual and procedural aspects of fractions (e.g., their bipartite structure and the whole-number bias32) explain the association between higher MA and lower performance in fraction tasks. Recently, Sidney and colleagues18 found a significant association between MA and fraction performance in a group of undergraduate students, suggesting that MA can still impact fraction performance among people with years of experience with fractions. Future studies should disentangle whether there is a specific association between MA and fraction tasks or between MA and more complex, cognitive-demanding mathematics tasks in general.
To the best of our knowledge, this is the first study to investigate the effects of MA on nonsymbolic ratio processing across different grades. If the RPS is intuitive, efficient, and less susceptible to MA, leveraging this system may have positive implications for fraction learning. For example, our group has demonstrated significant associations between nonsymbolic ratio and symbolic fractions comparisons, FK, and algebra skills in adults, suggesting that RPS acuity predicts symbolic FK and high-order mathematics.22 Building on these findings and others, we have argued that the RPS may foster the development of symbolic fraction processing and that building stronger links between nonsymbolic ratios and symbolic fractions may promote both conceptual and procedural FK.28 If the RPS proves to be an important predictor of fractions skills, leveraging this system in classrooms could be especially beneficial for children who have high MA, as the RPS may be more resistant to the effects of MA. Future intervention studies would be required to test this prediction.
Supplementary Material
Table S1. Descriptive statistics and comparison between younger male and female participants.
Table S2. Descriptive statistics and comparison between older male and female participants.
Table S3. Regression models including gender, with significant gender effects—math fluency—younger participants.
Table S4. Regression models including gender, with significant gender effects—FF (IES)—younger participants.
Table S5. Descriptive statistics and comparison between younger and older participants.
Table S6. Correlation table—younger participants.
Table S7. Correlation table—older participants.
Table S8. Nonsymbolic ratio comparisons—IES.
Table S10. Nonsymbolic ratio comparisons—reaction time.
Table S11. Cross-format comparisons—IES.
Table S12. Cross-format comparisons—accuracy.
Table S13. Cross-format comparisons—reaction time.
Table S14. Symbolic fraction comparisons—accuracy.
Table S15. Symbolic fraction comparisons—reaction time.
Acknowledgements
This research was supported by a Grant from the Eunice Kennedy Shriver National Institute of Child Health and Human Development (R01 HD088585) to E.M.H. and by a Core Grant (U54-HD090256–01) to the Waisman Intellectual and Developmental Disabilities Research Center. I.S.A. was supported by CAPES (Doc-Pleno, 88881.128282/2016–01).
Footnotes
Competing interests
The authors declare no competing interests.
References
- 1.Dreger RM & Aiken LR Jr. 1957. The identification of number anxiety in a college population. J. Educ. Psychol 48: 344–351. [Google Scholar]
- 2.Dowker A, Sarkar A & Looi CY. 2016. Mathematics anxiety: What have we learned in 60 years?. Front. Psychol 7: 508. [DOI] [PMC free article] [PubMed] [Google Scholar]
- 3.Ashcraft MH & Krause JA. 2007. Working memory, math performance, and math anxiety. Psychon. Bull. Rev 14: 243–248. [DOI] [PubMed] [Google Scholar]
- 4.Haase VG, Julio-Costa A, Pinheiro-Chagas P, et al. 2012. Math self-assessment, but not negative feelings, predicts mathematics performance of elementary school children. Child Dev. Res 2012: 982672. [Google Scholar]
- 5.Miller H & Bichsel J. 2004. Anxiety, working memory, gender, and math performance. Pers. Individ. Dif 37: 591–606. [Google Scholar]
- 6.Ramirez G, Gunderson EA, Levine SC, et al. 2013. Math anxiety, working memory, and math achievement in early elementary school. J. Cogn. Dev 14: 187–202. [Google Scholar]
- 7.Vukovic RK, Kieffer MJ, Bailey SP, et al. 2013. Mathematics anxiety in young children: Concurrent and longitudinal associations with mathematical performance. Contemp. Educ. Psychol 38: 1–10. [Google Scholar]
- 8.Carey E, Hill F, Devine A, et al. 2016. The chicken or the egg? The direction of the relationship between mathematics anxiety and mathematics performance. Front. Psychol 6: 1–6. [DOI] [PMC free article] [PubMed] [Google Scholar]
- 9.Hembree R 1990. The nature, effects, and relief of mathematics anxiety. J. Res. Math. Educ 21: 33–46. [Google Scholar]
- 10.Ma X & Xu J. 2004. The causal ordering of mathematics anxiety and mathematics achievement: a longitudinal panel analysis. J. Adolesc 27: 165–179. [DOI] [PubMed] [Google Scholar]
- 11.Maloney EA, Risko EF, Ansari D, et al. 2010. Mathematics anxiety affects counting but not subitizing during visual enumeration. Cognition 114: 293–297. [DOI] [PubMed] [Google Scholar]
- 12.Wang Z, Lukowski SL, Hart SA, et al. 2015. Is math anxiety always bad for math learning? The role of math motivation. Psychol. Sci 26: 1863–1876. [DOI] [PMC free article] [PubMed] [Google Scholar]
- 13.Ashcraft MH & Krirk EP. 2001. The relationships among working memory, math anxiety, and performance. J. Exp. Psychol. Gen 130: 224–237. [DOI] [PubMed] [Google Scholar]
- 14.Ashcraft MH 2002. Math Anxiety: Personal, educational, and cognitive consequences. Curr. Dir. Psychol. Sci 11: 181–185. [Google Scholar]
- 15.Dowker A 2005. “Individual Differences in Arithmetical Abilities: Implications for Psychology, Neuroscience and Education” New York: Psychology Press. [Google Scholar]
- 16.Ashcraft MH & Moore AM. 2009. Mathematics anxiety and the affective drop in performance. J. Psychoeduc. Assess 27: 197–205. [Google Scholar]
- 17.Jansen BRJ, Louwerse J, Straatemeier M, et al. 2013. The influence of experiencing success in math on math anxiety, perceived math competence, and math performance. Learn. Individ. Differ 24: 190–197. [Google Scholar]
- 18.Sidney PG, Thompson CA, Fitzsimmons C, et al. 2021. Children’s and adults’ math attitudes are differentiated by number type. J. Exp. Educ 89: 1–32. [Google Scholar]
- 19.Viegut A. Causal pathways from fractions to algebra: Integrating psychology and math education perspectives. Submitted [Google Scholar]
- 20.Booth JL & Newton KJ. 2012. Fractions: Could they really be the gatekeeper’s doorman ? Contemp. Educ. Educ. Psychol 37: 247–253. [Google Scholar]
- 21.Brown G & Quinn RJ. 2007. Investigating the relationship between fraction proficiency and success in algebra. Aust. Math. Teach 63: 8–15. [Google Scholar]
- 22.Matthews PG, Lewis MR & Hubbard EM. 2016. Individual differences in nonsymbolic ratio processing predict symbolic math performance. Psychol. Sci 27: 191–202. [DOI] [PubMed] [Google Scholar]
- 23.Siegler RS, Duncan GJ, Davis-Kean PE, et al. 2012. Early predictors of high school mathematics achievement. Psychol. Sci 23: 691–697. [DOI] [PubMed] [Google Scholar]
- 24.Bonato M, Fabbri S, Umiltà C, et al. 2007. The mental representation of numerical fractions: Real or integer? J. Exp. Psychol. Hum. Percept. Perform 33: 1410–1419. [DOI] [PubMed] [Google Scholar]
- 25.Gabriel FC, Coché F, Szucs D, et al. 2013. A componential view of children’s difficulties in learning fractions. Front. Psychol 4: 1–12. [DOI] [PMC free article] [PubMed] [Google Scholar]
- 26.Ganor-stern D, Karasik-rivkin I, Tzelgov J, et al. 2011. Holistic representation of unit fractions. Exp. Psychol 58: 201–206. [DOI] [PubMed] [Google Scholar]
- 27.Lortie-forgues H, Tian J & Siegler RS. 2015. Why is learning fraction and decimal arithmetic so difficult ? Dev. Rev 38: 201–221. [Google Scholar]
- 28.Siegler RS, Thompson CA & Schneider M. 2011. An integrated theory of whole number and fractions development. Cogn. Psychol 62: 273–296. [DOI] [PubMed] [Google Scholar]
- 29.Lewis MR, Matthews PG & Hubbard EM. 2016. Neurocognitive architectures and the nonsymbolic foundations of fractions understanding. In Development of Mathematical Cognition: Neural Substrates and Genetic Influences Berch Daniel B. & Geary DC, Eds. 141–164. London: Academic Press. [Google Scholar]
- 30.Siegler RS, Fazio LK, Bailey DH, et al. 2013. Fractions: the new frontier for theories of numerical development. Trends Cogn. Sci 17: 13–19. [DOI] [PubMed] [Google Scholar]
- 31.Krinzinger H, Kaufmann L & Willmes K. 2009. Math anxiety and math ability in early primary school years. J. Psychoeduc. Assess 27: 206–225. [DOI] [PMC free article] [PubMed] [Google Scholar]
- 32.Ni Y & Zhou YD. 2010. Teaching and learning fraction and rational numbers: The origins and implications of whole number bias. Educ. Psychol 40: 27–52. [Google Scholar]
- 33.Van Hoof J, Verschaffel L, De Neys W, et al. 2020. Intuitive errors in learners’ fraction understanding: A dual-process perspective on the natural number bias. Mem. Cogn 48: 1171–1180. [DOI] [PubMed] [Google Scholar]
- 34.Rayner V, Pitsolantis N & Osana H. 2009. Mathematics anxiety in preservice teachers: Its relationship to their conceptual and procedural knowledge of fractions. Math. Educ. Res. J 21: 60–85. [Google Scholar]
- 35.Sidney PG, Thalluri R, Buerke ML, et al. 2018. Who uses more strategies? Linking mathematics anxiety to adults’ strategy variability and performance on fraction magnitude tasks. Think. Reason 25: 94–131. [Google Scholar]
- 36.Eysenck MW & Calvo MG. 1992. Anxiety and Performance: The Processing Efficiency Theory. Cogn. Emot 6: 409–434. [Google Scholar]
- 37.Beilock SL 2008. Math performance in stressful situations. Curr. Dir. Psychol. Sci 17: 339–343. [Google Scholar]
- 38.Beilock SL & Carr TH. 2005. When high-powered people fail: Working memory and “choking under pressure” in math. Psychol. Sci 16: 101–105. [DOI] [PubMed] [Google Scholar]
- 39.Wu SS, Barth M, Amin H, et al. 2012. Math anxiety in second and third graders and its relation to mathematics achievement. Front. Psychol 3: 1–11. [DOI] [PMC free article] [PubMed] [Google Scholar]
- 40.Evans JSBT 2008. Dual-processing accounts of reasoning, judgment, and social cognition. Annu. Rev. Psychol 59: 255–278. [DOI] [PubMed] [Google Scholar]
- 41.Shiffrin RM & Schneider W. 1977. Controlled and automatic human information processing: II. Perceptual learning, automatic attending and a general theory. Psychol. Rev 84: 127. [Google Scholar]
- 42.Stroop JR 1935. Studies of interference in serial verbal reactions. J. Exp. Psychol 18: 643–662. [Google Scholar]
- 43.Maloney EA, Ansari D & Fugelsang JA. 2011. Rapid Communication: the effect of mathematics anxiety on the processing of numerical magnitude. Q. J. Exp. Psychol 64: 10–16. [DOI] [PubMed] [Google Scholar]
- 44.Núñez-Peña MI & Suárez-Pellicioni M. 2014. Less precise representation of numerical magnitude in high math-anxious individuals: an ERP study of the size and distance effects. Biol. Psychol 103: 176–183. [DOI] [PubMed] [Google Scholar]
- 45.Braham EJ & Libertus ME. 2018. When approximate number acuity predicts math performance: The moderating role of math anxiety. PLoS One 13: 1–14. [DOI] [PMC free article] [PubMed] [Google Scholar]
- 46.Colomé A 2019. Representation of numerical magnitude in math-anxious individuals. Q. J. Exp. Psychol 72: 424–435. [DOI] [PubMed] [Google Scholar]
- 47.Dietrich JF, Huber S, Moeller K, et al. 2015. The influence of math anxiety on symbolic and non-symbolic magnitude processing. Front. Psychol 6: 1–10. [DOI] [PMC free article] [PubMed] [Google Scholar]
- 48.Kalra PB, V Binzak J, Matthews PG, et al. 2020. Symbolic fractions elicit an analog magnitude representation in school-age children. J. Exp. Child Psychol 195: 104844. [DOI] [PMC free article] [PubMed] [Google Scholar]
- 49.Park Y, Viegut AA & Matthews PG. 2020. More than the sum of its parts: Exploring the development of ratio magnitude versus simple magnitude perception. Dev. Sci 24: 1–15. [DOI] [PMC free article] [PubMed] [Google Scholar]
- 50.Matthews PG & Lewis MR. 2017. Fractions we cannot ignore: The nonsymbolic ratio congruity effect. Cogn. Sci 41: 1656–1674. [DOI] [PubMed] [Google Scholar]
- 51.Suinn RM, Taylor S & Edwards RW. 1988. Suinn mathematics anxiety rating scale for elementary school students (MARS-E): Psychometric and normative data. Educ. Psychol. Meas 48: 979–986. [Google Scholar]
- 52.Woodcock RW, McGrew KS & Mather N. 2001. “Woodcock-Johnson III tests of cognitive abilities” Itasca, IL: Riverside Publishing. [Google Scholar]
- 53.Wechsler D 2003. “WISC-IV technical and interpretive manual” San Antonio, TX: Psychological Corporation. [Google Scholar]
- 54.Woodcock RW, McGrew KS & Mather N. 2001. “Woodcock-Johnson III tests of achievement” Itasca, IL: Riverside Publishing. [Google Scholar]
- 55.Carpenter TP, Corbitt MK, Kepner HS, et al. 1980. Results of the second NAEP mathematics assessment: Secondary school. Math. Teach 73: 329–338. [Google Scholar]
- 56.Hallett D, Nunes T, Bryant P, et al. 2012. Individual differences in conceptual and procedural fraction understanding: The role of abilities and school experience. J. Exp. Child Psychol 113: 469–486. [DOI] [PubMed] [Google Scholar]
- 57.Malykh S, Kuzmina Y & Tikhomirova T. 2021. Developmental changes in ANS precision across grades 1–9: Different patterns of accuracy and reaction time. Front. Psychol 12: 1–19. [DOI] [PMC free article] [PubMed] [Google Scholar]
- 58.Bruyer R & Brysbaert M. 2011. Combining speed and accuracy in cognitive psychology: Is the inverse efficiency score (IES) a better dependent variable than the mean reaction time (RT) and the percentage of errors (PE)?. Psychol. Belg 51: 5–13. [Google Scholar]
- 59.Ganley CM & Lubienski ST. 2016. Mathematics confidence, interest, and performance: Examining gender patterns and reciprocal relations. Learn. Individ. Differ 47: 182–193. [Google Scholar]
- 60.Dowker A, Bennett K & Smith L. 2012. Attitudes to mathematics in primary school children. Child Dev. Res 1–8. [Google Scholar]
- 61.Sorvo R, Koponen T, Viholainen H, et al. 2017. Math anxiety and its relationship with basic arithmetic skills among primary school children. Br. J. Educ. Psychol 87: 309–327. [DOI] [PubMed] [Google Scholar]
- 62.Harari RR, Vukovic RK & Bailey SP. 2013. Mathematics anxiety in young children: An exploratory study. J. Exp. Educ 81: 538–555. [Google Scholar]
- 63.Gierl MJ & Bisanz J. 1995. Anxieties and attitudes related to mathematics in grades 3 and 6. J. Exp. Educ 63: 139–158. [Google Scholar]
- 64.Plass JA & Hill KT. 1986. Children’s Achievement Strategies and Test Performance. The Role of Time Pressure, Evaluation Anxiety, and Sex. Dev. Psychol 22: 31–36. [Google Scholar]
- 65.Wu SS, Barth M, Amin H, et al. 2012. Math anxiety in second and third graders and its relation to mathematics achievement. Front. Psychol 3: 1–11. [DOI] [PMC free article] [PubMed] [Google Scholar]
- 66.Barrouillet P & Lépine R. 2005. Working memory and children’s use of retrieval to solve addition problems. J. Exp. Child Psychol 91: 183–204. [DOI] [PubMed] [Google Scholar]
- 67.De Smedt B, Holloway ID & Ansari D. 2011. Effects of problem size and arithmetic operation on brain activation during calculation in children with varying levels of arithmetical fluency. Neuroimage 57: 771–781. [DOI] [PubMed] [Google Scholar]
- 68.Geary DC & Hoard MK. 2005. Learning disabilities in arithmetic and mathematics: Theoretical and empirical perspectives. In Handbook of mathematical cognition Campbell JID, Ed. 253–267. New York: Psychology Press. [Google Scholar]
- 69.Maloney EA & Beilock SL. 2012. Math anxiety: Who has it, why it develops, and how to guard against it. Trends Cogn. Sci 16: 404–406. [DOI] [PubMed] [Google Scholar]
- 70.Soltanlou M, Artemenko C, Dresler T, et al. 2019. Math anxiety in combination with low visuospatial memory impairs math learning in children. Front. Psychol 10: 1–10. [DOI] [PMC free article] [PubMed] [Google Scholar]
- 71.Ramirez G, Chang H, Maloney EA, et al. 2016. On the relationship between math anxiety and math achievement in early elementary school: The role of problem solving strategies. J. Exp. Child Psychol 141: 83–100. [DOI] [PubMed] [Google Scholar]
- 72.Fazio LK, Bailey DH, Thompson CA, et al. 2014. Relations of different types of numerical magnitude representations to each other and to mathematics achievement. J. Exp. Child Psychol 123: 53–72. [DOI] [PubMed] [Google Scholar]
- 73.Meert G, Grégoire J, Seron X, et al. 2012. The mental representation of the magnitude of symbolic and nonsymbolic ratios in adults. Q. J. Exp. Psychol 65: 702–724. [DOI] [PubMed] [Google Scholar]
- 74.Mock J, Huber S, Bloechle J, et al. 2018. Magnitude processing of symbolic and non-symbolic proportions: an fMRI study. Behav. Brain Funct 14: 1–19. [DOI] [PMC free article] [PubMed] [Google Scholar]
- 75.Kazelskis R, Reeves C, Kersh ME, et al. 2000. Mathematics anxiety and test anxiety: Separate constructs? J. Exp. Educ 68: 137–146. [Google Scholar]
- 76.Pizzie RG & Kraemer DJM. 2019. The Academic Anxiety Inventory: Evidence for dissociable patterns of anxiety related to math and other sources of academic stress. Front. Psychol 9: 1–20. [DOI] [PMC free article] [PubMed] [Google Scholar]
- 77.Simmons FR, Willis C & Adams AM. 2012. Different components of working memory have different relationships with different mathematical skills. J. Exp. Child Psychol 111: 139–155. [DOI] [PubMed] [Google Scholar]
Associated Data
This section collects any data citations, data availability statements, or supplementary materials included in this article.
Supplementary Materials
Table S1. Descriptive statistics and comparison between younger male and female participants.
Table S2. Descriptive statistics and comparison between older male and female participants.
Table S3. Regression models including gender, with significant gender effects—math fluency—younger participants.
Table S4. Regression models including gender, with significant gender effects—FF (IES)—younger participants.
Table S5. Descriptive statistics and comparison between younger and older participants.
Table S6. Correlation table—younger participants.
Table S7. Correlation table—older participants.
Table S8. Nonsymbolic ratio comparisons—IES.
Table S10. Nonsymbolic ratio comparisons—reaction time.
Table S11. Cross-format comparisons—IES.
Table S12. Cross-format comparisons—accuracy.
Table S13. Cross-format comparisons—reaction time.
Table S14. Symbolic fraction comparisons—accuracy.
Table S15. Symbolic fraction comparisons—reaction time.