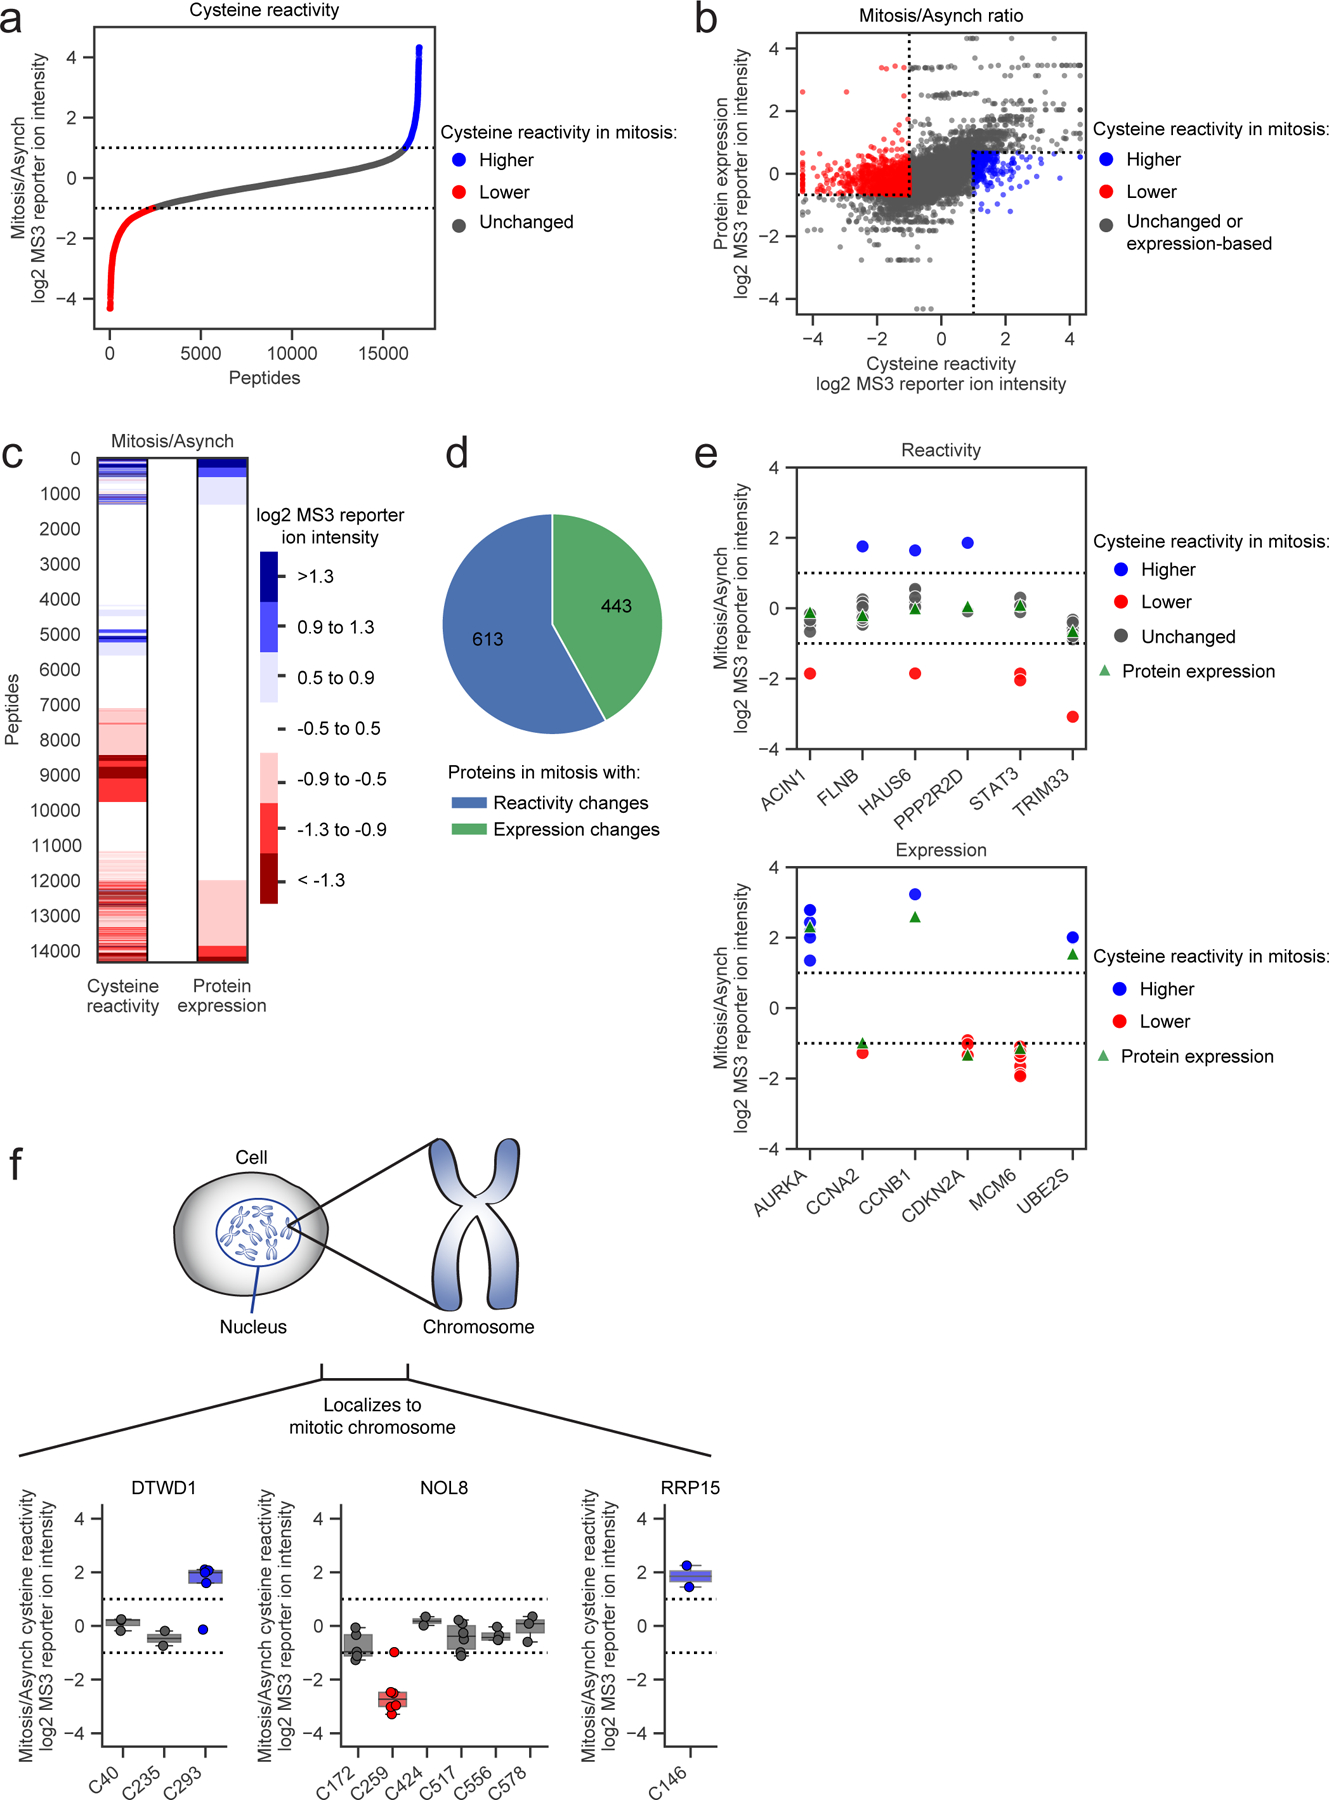
Figure 1. Cysteine reactivity profiling of mitotic and asynchronous cells.

a, Cysteine reactivity ratio values of mitotic vs asynchronous (Mitosis/Asynch) HeLa cell proteomes. Blue and red data points mark cysteine reactivity values that are ≥ two-fold higher (dotted lines) in mitotic or asynchronous proteomes, respectively. Each data point is median value for n = 2 (or more) independent experiments. b, c, Comparison of cysteine reactivity values to the expression values for corresponding proteins harboring these cysteines in scatter plot (b) or heat map (c) format. Ratio values are presented as Mitosis/Asynch (log2 transformed). For b, blue and red mark cysteine reactivity values ≥ two-fold higher in mitotic or asynchronous proteomes, respectively, where the corresponding protein expression value is unchanged (< 1.6x-fold different Mitosis/Asynch). For c, blue and red mark cysteine reactivity or protein expression values that are ≥ two-fold higher in mitotic or asynchronous cell proteomes, respectively. Data shown are median values for n = 2 (or more) independent TMT-ABPP experiments and n = 1 (or more) independent unenriched proteomics experiments. d, Distribution of proteins with cysteine changes assigned as reactivity-based (blue) or expression-based (green) in the mitotic proteome. Proteins with unassigned cysteine changes are not shown. e, Representative reactivity-based (top) and expression-based (bottom) cysteine changes with corresponding protein expression values (Mitosis/Asynch). Dotted lines designate ≥ two-fold changes. Data shown are median values for n = 2 (or more) independent TMT-ABPP experiments and n = 1 (or more) independent unenriched proteomics experiments f, Cysteine reactivity changes in proteins DTWD1 (left), NOL8 (middle), and RRP15 (right) shown to localize to mitotic chromosomes16 (top). Bottom, box plots showing cysteine reactivity profiles for each protein, where blue and red colors mark cysteines with greater reactivity in the mitotic and asynchronous proteomes, respectively. Horizontal black line for each cysteine marks median value, boxes mark upper and lower quartiles, and whiskers mark 1.5x interquartile range. Dotted lines designate boundaries for ≥ two-fold changes for n = 2 (or more) independent experiments (circles).
