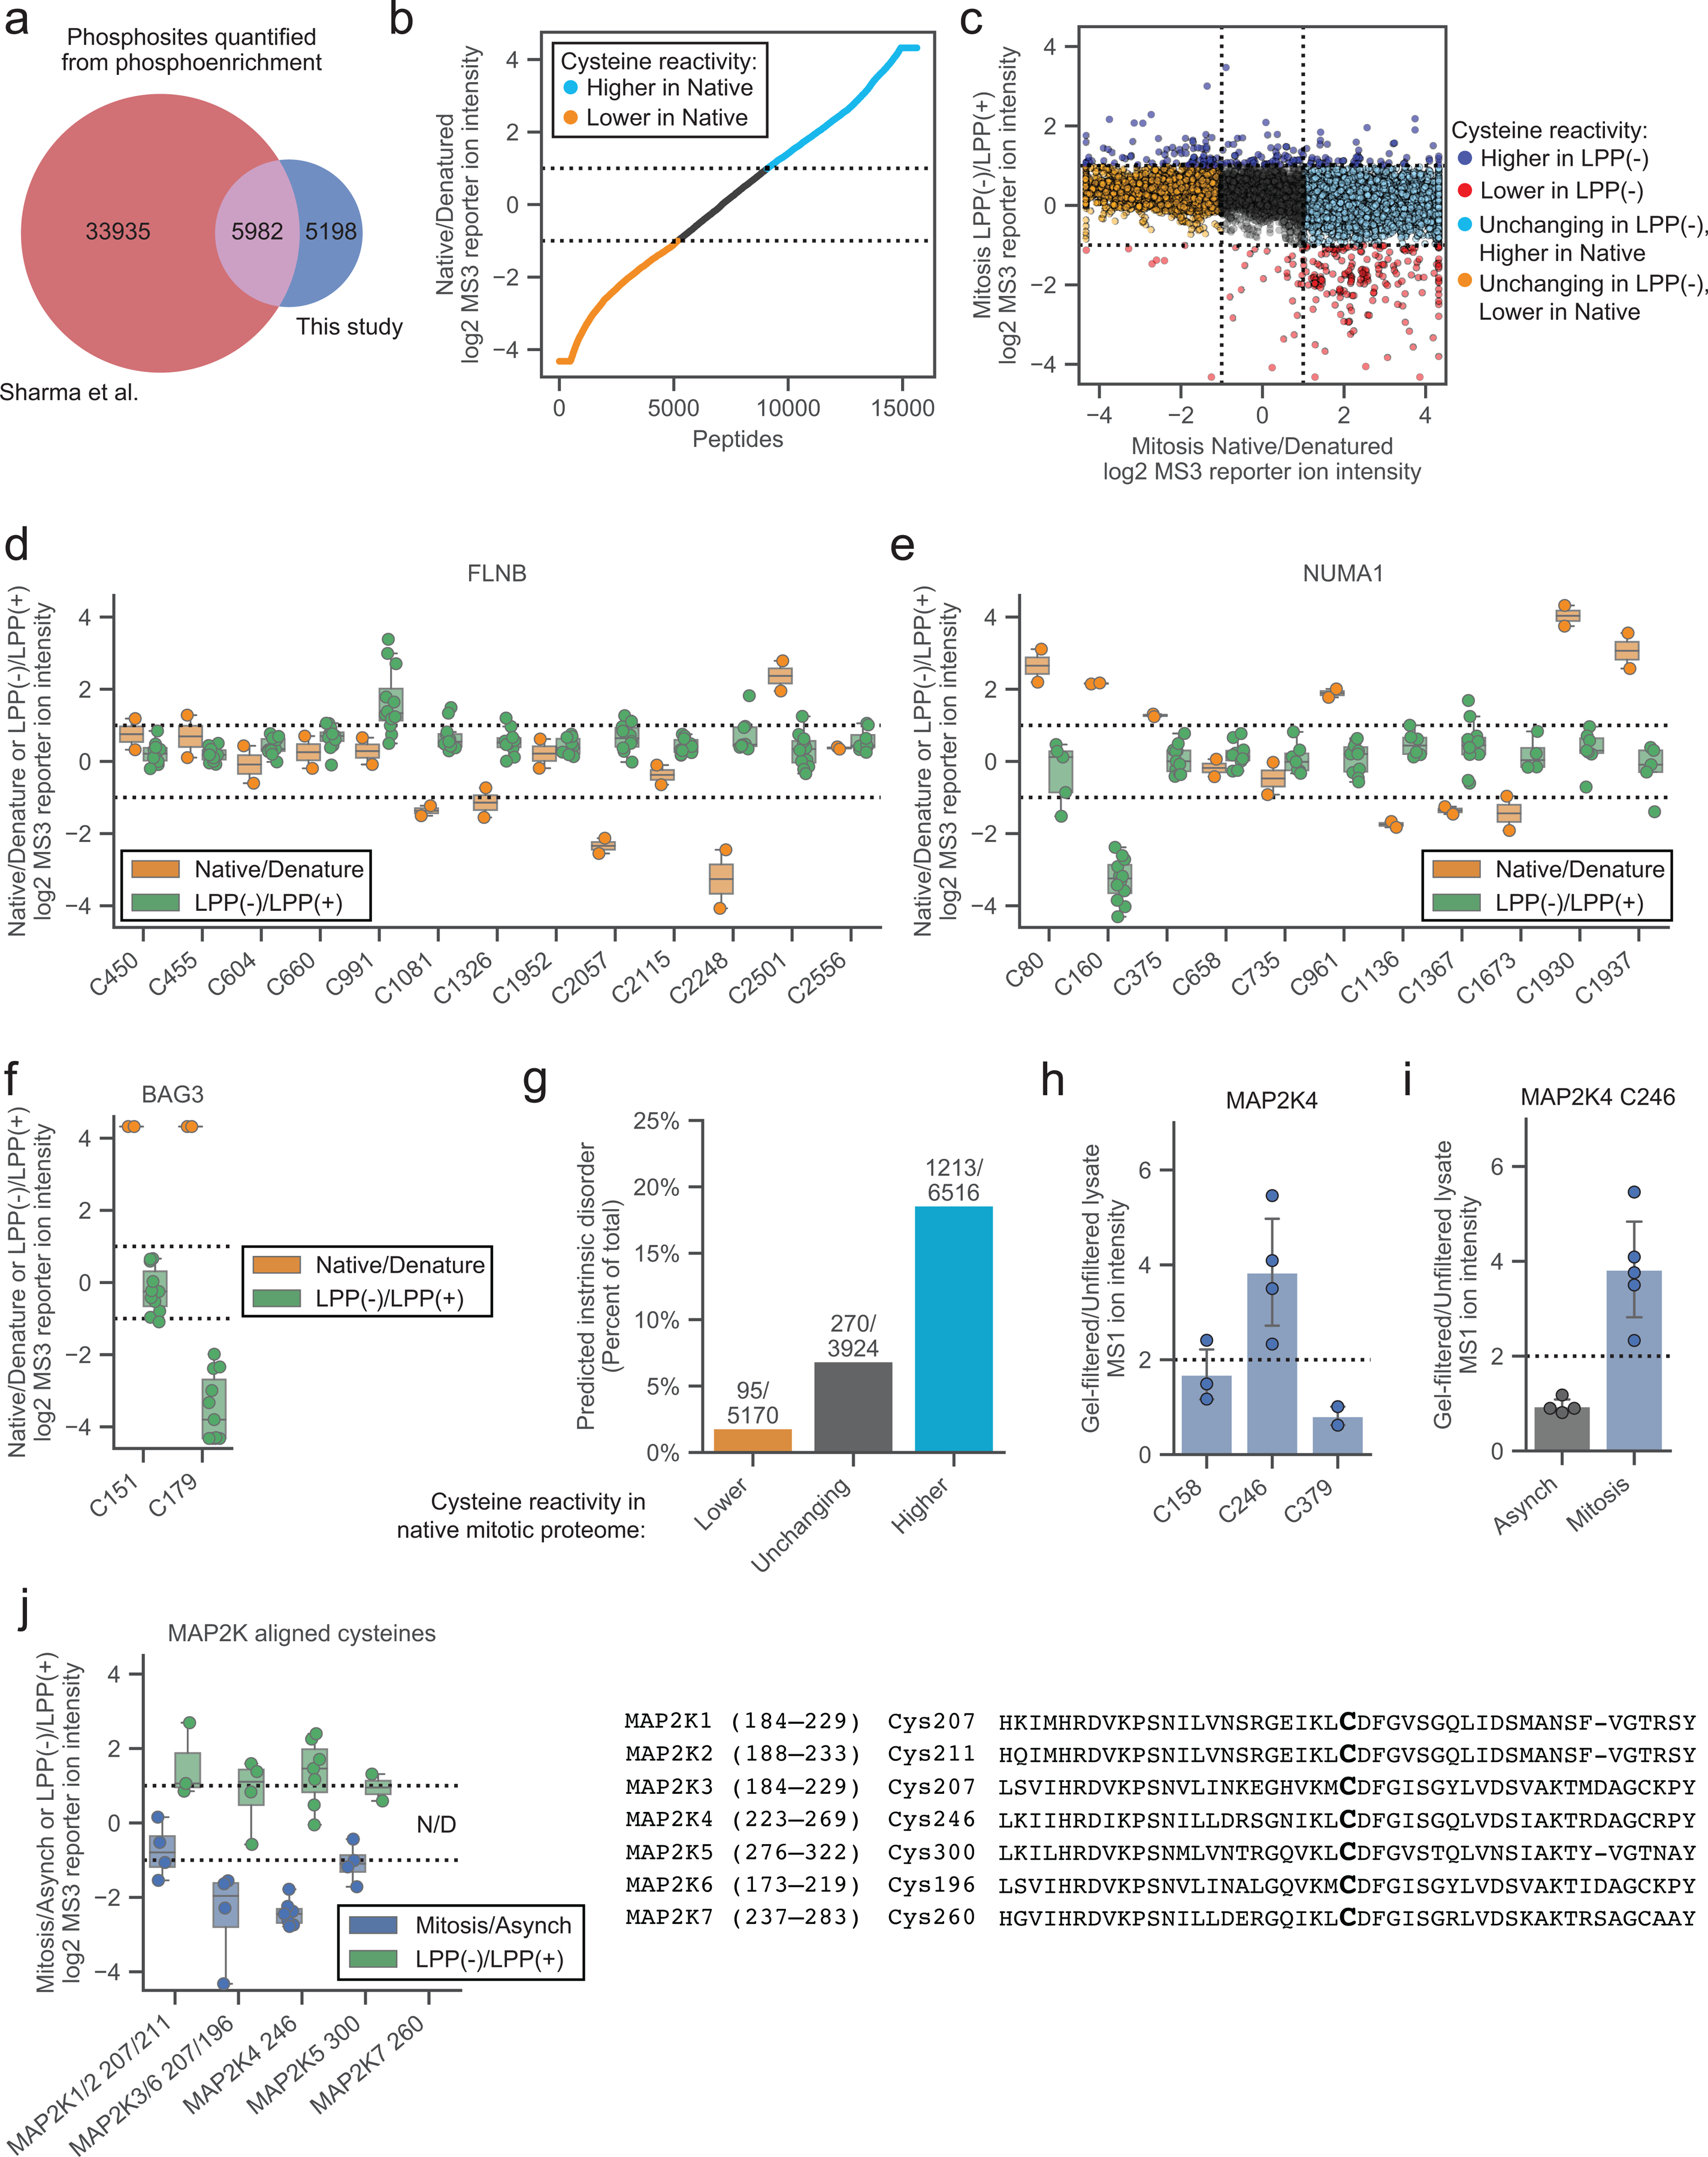
Extended Data Fig. 2. A proteomic method to map phosphorylation-dependent changes in cysteine reactivity.

a, Venn diagram of phosphorylated S/T residues quantified by Sharma et al.21 (red) and this study (dark blue) in asynchronous and mitotic cell proteomes. b, Cysteine reactivity ratio values in Native/Denatured mitotic proteome. Light blue and orange data mark cysteine reactivity values that are ≥ two-fold higher (boundary marked by dotted lines) in native and denatured cell proteome, respectively. Data are the median value for n = 1 (or more) independent experiments. c, Comparison of cysteine reactivity values from LPP(−)/LPP(+) (y-axis) and Native/Denatured (x-axis) proteomes. Blue and red data mark cysteine reactivity values that are ≥ two-fold higher in LPP(−) and LPP(+) cell proteomes, respectively. Light blue and orange data mark cysteines that are unchanging in LPP(−)/LPP(+), but changing two-fold in Native/Denatured mitotic proteomes. Dotted lines mark boundaries for cysteines that change ≥ two-fold in reactivity in LPP(−)/LPP(+) and Native/Denatured. Data are the median value for n = 2 (or more) independent LPP(−)/LPP(+) experiments and n = 1 (or more) Native/Denatured experiments. d-f, Cysteine reactivity values across Native/Denatured proteome (orange) and LPP(−)/LPP(+) (green) mitotic proteome for cysteines in d) FLNB, e) NUMA1, and f) BAG3. Horizontal black lines mark median value, boxes mark upper and lower quartiles, and whiskers mark 1.5x interquartile range for n = 2 (or more) independent experiments (circles). Dotted lines designate boundaries for ≥ two-fold changes. g, Percentage of cysteines in predicted disordered domains (IUPreD ≥ 0.5)48. h, Cysteine reactivity values for MAP2K4 in gel-filtred mitotic cell proteome. Data represent the average values +/− standard deviation for n = 2 (or more) independent experiments (circles). i, MAP2K4 C246 reactivity in gel-filtered asynchronous (gray) vs mitotic (blue) cell proteomes. Data represent the average values +/− standard deviation for n = 4 (or more) independent experiments (circles). j, Left, MAP2K ATP-binding pocket cysteine reactivity. Nonunique peptides are assigned to both MAP2Ks. Horizontal black lines mark median value, boxes mark upper and lower quartiles, and whiskers mark 1.5x interquartile range for n = 2 (or more) independent experiments (circles). Dotted lines designate boundaries for ≥ two-fold changes. Right, sequence alignment of MAP2K proteins centered on MAP2K4 ATP-binding pocket C246.
