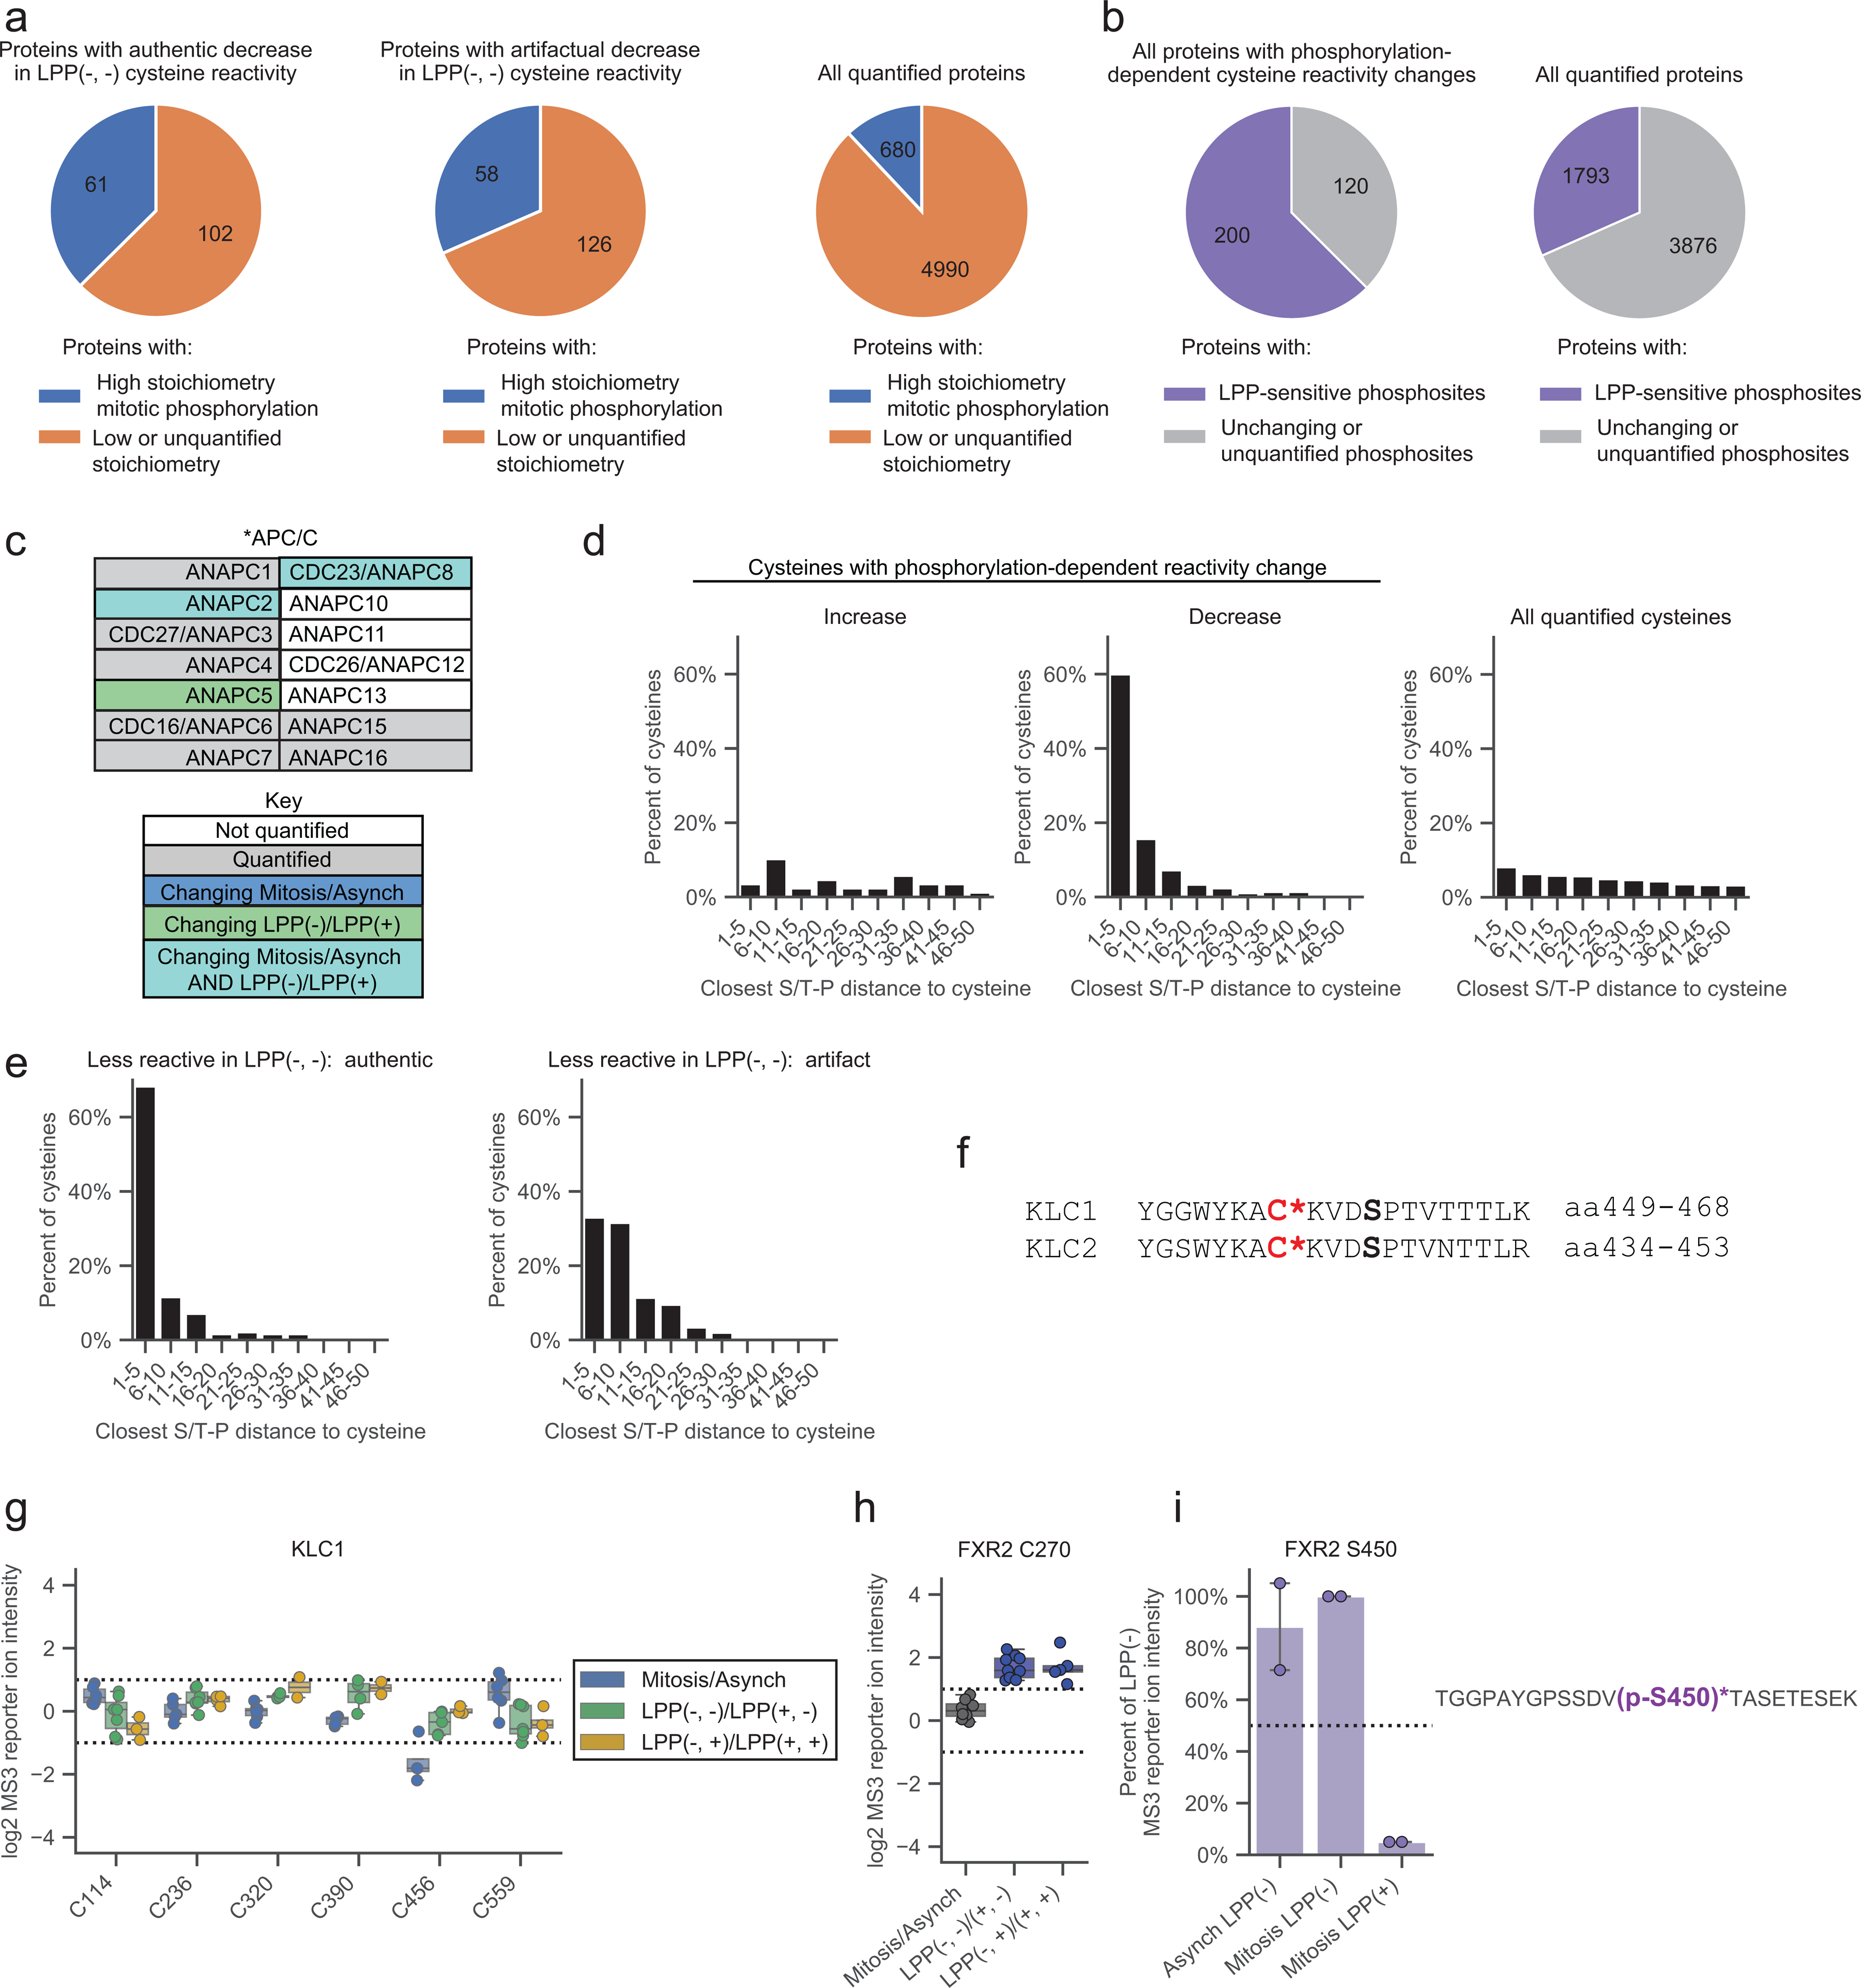
Extended Data Figure 4. Features of proteins with mitotic phosphorylation-dependent changes in cysteine reactivity.

a, Proteins with authentic (left) and artifactual (middle) phosphorylation-dependent cysteine reactivity changes are enriched for high stoichiometry mitotic phosphorylation sites21 (blue) compared to all quantified proteins (right). Proteins lacking sufficient data for phosphorylation stoichiometry calculation or exhibiting only low stoichiometry (< 50% occupancy) sites21 were labeled as ‘Low or unquantified stoichiometry’ (orange). b, Proteins with phosphorylation-dependent cysteine reactivity changes (left) are enriched for LPP-sensitive mitotic phosphorylation sites (purple) compared to all quantified proteins (right). Proteins with only artifactual cysteine reactivity changes were removed from analysis. Proteins with LPP-insensitive or no quantified phosphorylation sites were labeled as “Unchanging or unquantified phosphosites” (gray). c, Members of the anaphase-promoting complex (APC/C) of the KEGG cell cycle pathway (HSA04110).55 Proteins are as described in Fig. 4b. d, Fraction of cysteines showing phosphorylation-dependent reactivity changes within the specified amino acid distances from an S/T-P site. Artifactual phosphorylation-dependent cysteine reactivity changes were omitted from analysis. e, Fraction of cysteines showing authentic (left) versus artifactual (right) phosphorylation-dependent reactivity changes within the specified amino acid distances from an S/T-P site. Authentic and artifactual changes were determined as described in Figure 3f. f, Sequence alignment of the KLC1 and KLC2 proteins centered on C456 and C441, respectively (asterisks, red, bold). Known (KLC1) and predicted (KLC2) S-P phosphorylation motifs are marked (black, bold). g, KLC1 cysteine reactivity values across the indicated comparison groups. Horizontal black lines mark median value, boxes mark upper and lower quartiles, and whiskers mark 1.5x interquartile range for n = 2 (or more) independent experiments (circles). Dotted lines designate boundaries for ≥ two-fold changes. h, FXR2 C270 reactivity values for indicated comparison groups. Horizontal black lines mark median value, boxes mark upper and lower quartiles, and whiskers mark 1.5x interquartile range for n = 5 (or more) independent experiments (circles). Dotted lines designate boundaries for ≥ two-fold changes. i, Left, phosphopeptide enrichment of FXR2 p-S450. Data were normalized to Mitosis LPP(−) and represent the median values +/− standard deviation for n = 2 independent experiments (circles). Right, tryptic peptides containing phosphorylated (p-, purple, bold) FXR2 p-S450 (asterisks, purple, bold).
