Figure 1.
Hydrostatic pressure exposure and transcriptome data analysis in zebrafish
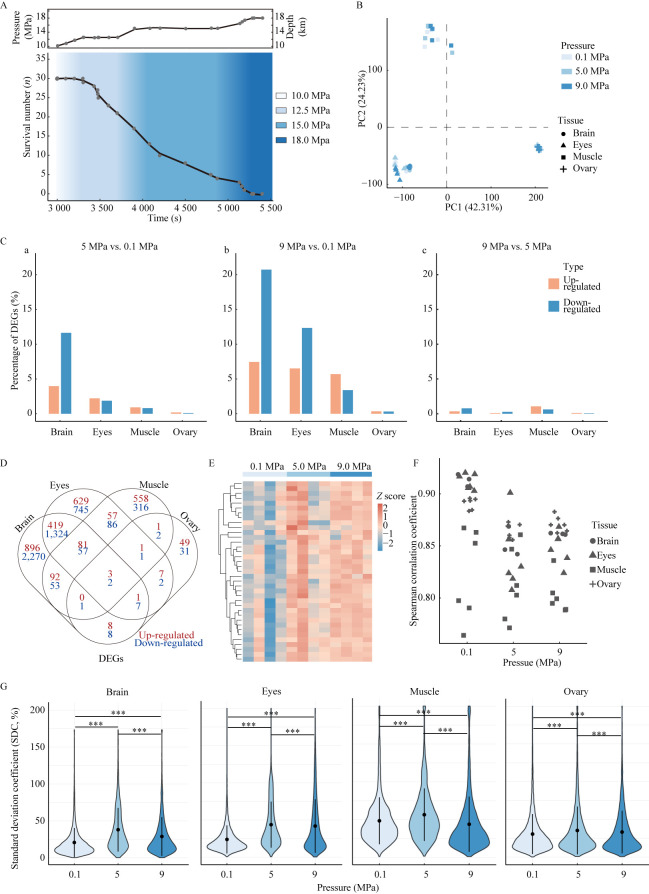
A: Fitted curves of pressure and zebrafish survival number against experimental time. B: Cluster diagram of principal component analysis for all samples. C: Proportion of up- and down-regulated DEGs among all selected genes in each tissue. a: Proportion of DEGs in 5 MPa-treated group vs. 0.1 MPa-treated control; b: Proportion of DEGs in 9 MPa-treated group vs. 0.1 MPa-treated control; c: Proportion of DEGs in 9 MPa-treated group vs. 5 MPa-treated group. D: Venn diagram of up- and down-regulated DEGs in 5 MPa-treated group vs. 0.1 MPa-treated control and 9 MPa-treated group vs. 0.1 MPa-treated control. E: Heatmap of βγ-crystallin gene family expression in eyes. F: Distribution of Spearman correlation coefficients for samples within groups of each tissue. G: Violin diagram of standard deviation coefficient (SDC) distribution for each tissue (***: P<0.001, KS-test).

