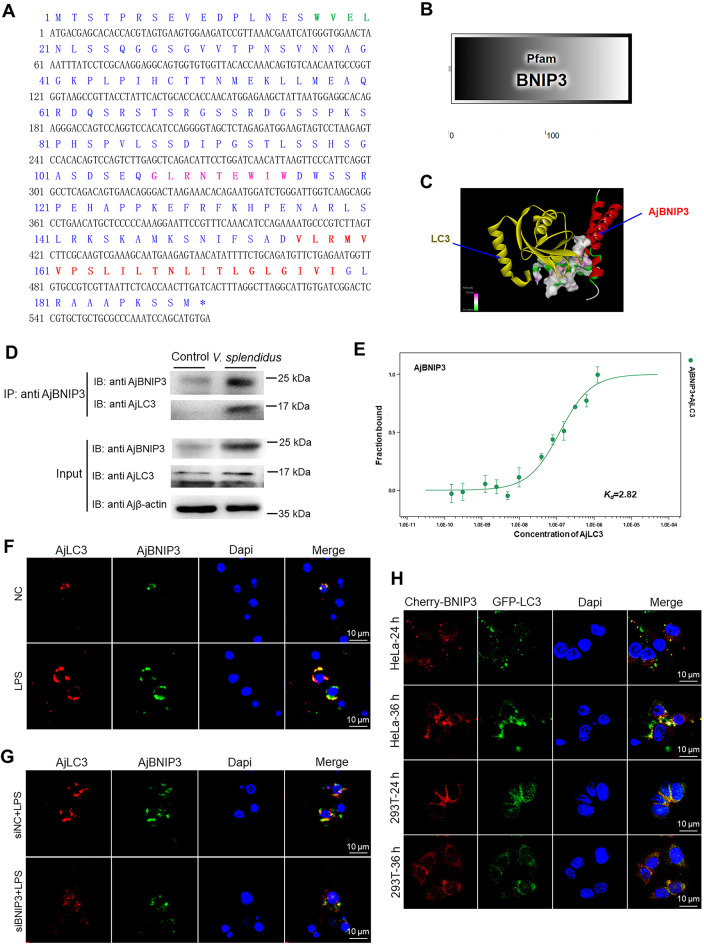
Figure 4.
Initiation of mitophagy by AjBNIP3 and AjLC3 interactions
A: Amino acid (aa) sequence analysis of AjBNIP3. Entire deduced aa sequence is depicted using single letter codes above corresponding nucleotide sequence. LIR is marked in green and indicated in bold. BH3 domain is marked in pink and indicated in bold. C-terminal transmembrane domain is marked in red and indicated in bold. B: Predicted 2D structural model of AjBNIP3. C: Predicted combination model of AjBNIP3 and AjLC3. D: Co-immunoprecipitation of AjBNIP3 and AjLC3 after V. splendidus infection for 48 h. E: Microscale thermophoresis (MST) assays of interactions between His-AjBNIP3 and His-AjLC3. Solid curve is the fit of data points to the standard Kd-fit function. Experiments were repeated at least three times. F: Immunofluorescence colocalization analysis of AjBNIP3 and AjLC3 after LPS treatment for 12 h, with DAPI (blue) staining to identify nuclei. G: Immunofluorescence colocalization analysis of AjBNIP3 and AjLC3 in coelomocytes after transfection with AjBNIP3 siRNA and subsequent exposure to LPS for 12 h, with DAPI (blue) staining to identify nuclei. H: Cotransfection of pCMV-N-Cherry-AjBNIP3 and pIRES2-EGFP-AjLC3 in HeLa and HEK 293T cells for 24 and 36 h, with DAPI (blue) staining to identify nuclei.

