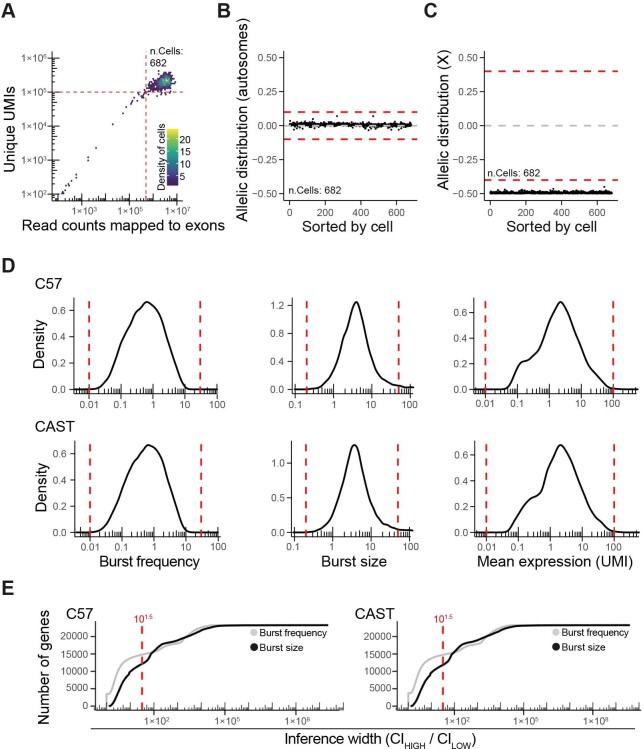
Extended Data Fig. 3. Quality controls of bursting inference data.
(A) Scatter plot showing the number of sequenced read counts mapped to exons (Smart-seq3 libraries, n = 682 cells passing quality control) (red lines represent quality control cutoffs). (B) Scatter plot showing the distribution of allele sensitive read counts for non-imprinted autosomal genes (red dashed lines represent quality control cutoffs). (C) Scatter plot showing the distribution of allele sensitive read counts for non-escapee genes on the X-chromosome (red dashed lines represent quality control cutoff). (D) Density plots for burst frequencies, burst sizes and mean expression (for allele distributed UMIs). Red dashed lines represent cutoffs for passing the quality control. (E) Scatter plots representing widths of confidence intervals (x-axis) against genes (y-axis, sorted by widths of confidence intervals) for burst frequencies and burst sizes. Red dashed lines represent cutoffs for passing the quality control.

