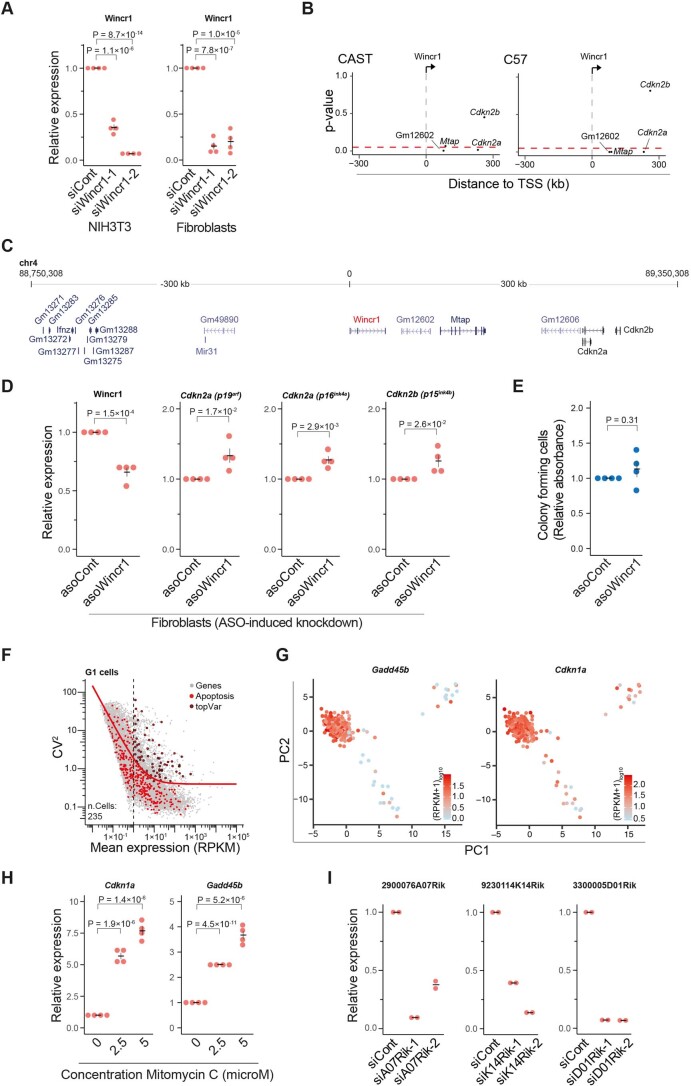
Extended Data Fig. 7. Analysis of Wincr1 and identification of apoptosis-associated lncRNAs.
(A) Relative expression of Wincr1 upon siRNA induced knockdown in NIH/3T3 cells (left) and primary fibroblasts (right) measured by RT-qPCR (n = 4 biologically independent samples). (B) Scatter plots showing p-values for co-expression of Wincr1 (Fisher’s exact test) against other genes in proximity (± 300 kb of TSS-Wincr1, genes filtered for > = 3 allelic counts) for the CAST and C57 genomes. The red dashed lines denote threshold for significance (p < 0.05). (C) A schematic from the UCSC genome browser representing the Wincr1 gene locus. (D) Relative expression of candidate cis-interacting genes upon ASO induced knockdown of Wincr1 in primary fibroblast cells measured by RT-qPCR (n = 4 biologically independent samples). (E) Quantification of colony forming cells upon ASO induced knockdown of Wincr1 in NIH/3T3 cells (n = 4 biologically independent samples). (F) Scatter plot showing the 75 most variable genes related to apoptosis, on top of a scatter plot showing mean expression levels (x-axis) and CV2 (y-axis) (n = 235 cells). (G) Low dimensional PCA projections of cells based on the most variable genes identified in (F), colored by the expression of Gadd45b and Cdkn1a (n = 235 cells). (H) Relative expression measured by RT-qPCR for Gadd45b and Cdkn1a in NIH/3T3 cells treated with MMC (n = 4 biologically independent samples). (I) Relative expression of candidate lncRNAs upon siRNA induced knockdown in NIH/3T3 cells measured by RT-qPCR (n = 2 biologically independent samples, horizontal lines represent the mean expression). A, D, E, H; data presented as mean values + /- s.e.m., p-values represent a two-sided Student’s t-test.

