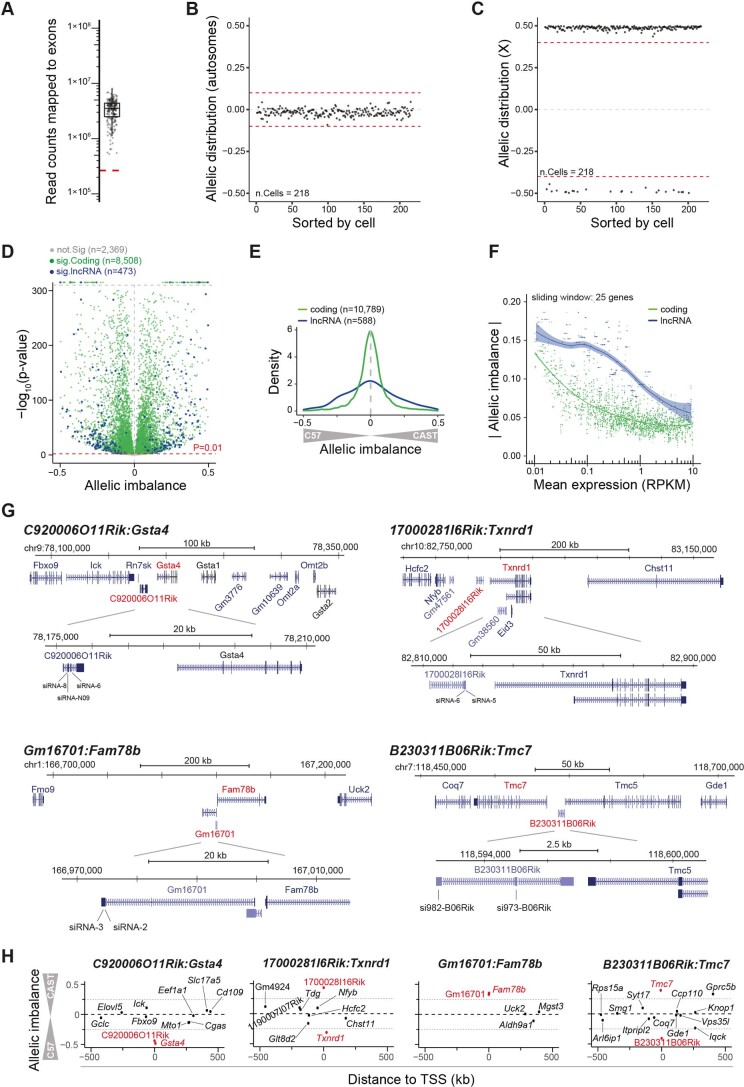
Extended Data Fig. 8. Control experiments on allelic imbalance in fibroblast cells.
(A-C) Quality control for Smart-seq2 libraries from CASTxC57 primary fibroblast cells. Red lines represent quality control cutoff. (A) Boxplot showing number of sequenced reads counts mapped to exons (Smart-seq2 libraries, n = 218 cells). The center line shows the median, interquartile limits indicate the 25th and 75th percentiles and whiskers denote the farthest points at a maximum of 1.5 times the IQR. (B) Scatter plot showing the distribution of allele sensitive read counts for non-imprinted autosomal genes. (C) Scatter plot showing the distribution of allele sensitive read counts for non-escapee genes on the X-chromosome. (D) Scatter plot of the allelic imbalance against p-values (binomial test, Benjamini-Hochberg adjusted) across fibroblasts (n = 751 cells). (E) Density plot summarizing observed allelic imbalance of lncRNAs and mRNAs across fibroblasts (n = 751 cells). (F) Mean expression towards the median of allelic imbalance of a sliding window (width = 25) for mRNAs and lncRNAs. The green and blue lines denote a loess fit to the sliding window with a 95% confidence interval for mRNAs and lncRNAs, respectively. (G) Schematics from the UCSC genome browser representing the gene loci of four candidate lncRNA-mRNA gene pair interactions. (H) Scatter plot representing allelic imbalance of genes within + /−500kb (of lncRNA TSS) of candidate genes. Candidate lncRNA-mRNA gene pair interactions are colored in red.

