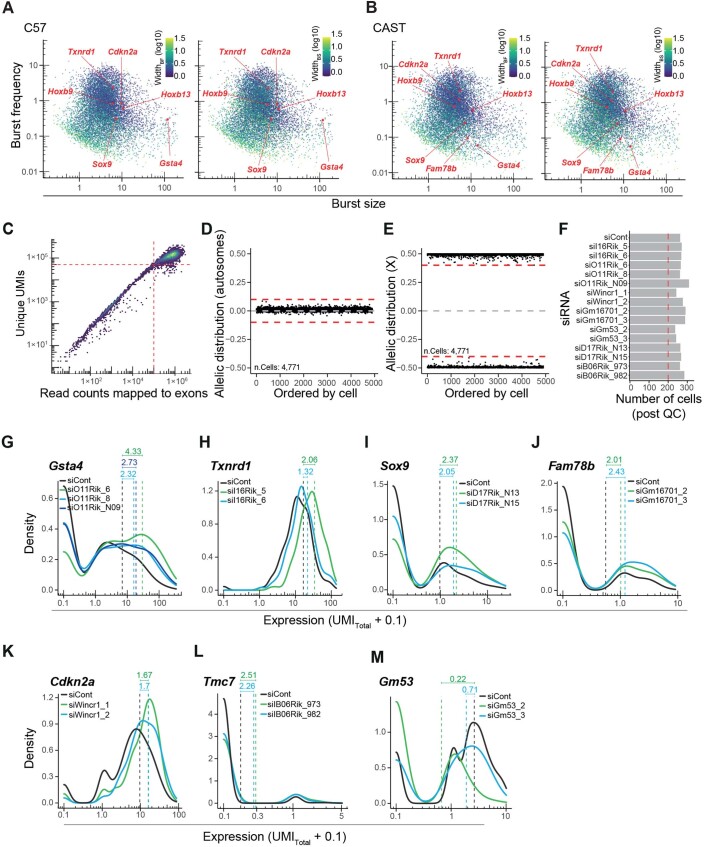
Extended Data Fig. 10. Analyses of lncRNAs’ effect on burst kinetics of nearby mRNAs.
(A,B) Scatter plots showing the burst sizes against the burst frequencies for the C57 (A) and CAST (B) genomes. Genes are colored according to the width of a 95% confidence interval (CIhigh/CIlow). (C-E) Quality control for Smart-seq3 libraries from siRNA treated primary fibroblast cells (red lines represent quality control cutoffs); scatter plot showing the number of unique UMI reads against the number of read counts mapped to exons (C), scatter plot showing the distribution of allele sensitive read counts for non-imprinted autosomal genes (D), and scatter plot showing the distribution of allele sensitive read counts for non-escapee genes on the X-chromosome (E). (F) Barplot representing the number of cells passing quality control for individual siRNA treatments. (G-L) Density plots representing mean expression (UMIs) of modulated genes upon siRNA induced suppression of lncRNAs for Gsta4 (G), Txnrd1 (H), Sox9 (I), Fam78b (J), Cdkn2a (K) and Tmc7 (L). (M) Density plot representing expression of the lncRNA Gm53 upon siRNA induced knockdown. G-M; mean expression fold changes are quantified and highlighted in green and blue. Vertical dashed lines represent mean expression levels.

