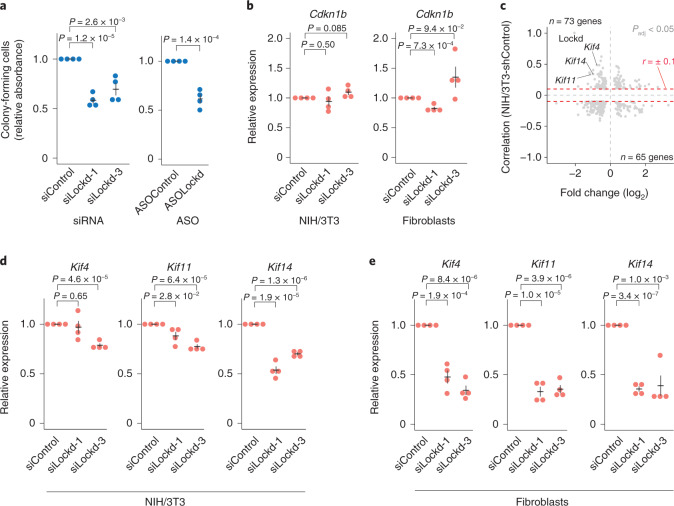
Fig. 4. Functional analysis of the lncRNA Lockd.
a, Quantification of colony-forming cells on siRNA- and ASO-induced knockdown of Lockd in NIH/3T3 cells. b, Relative expression of Cdkn1b on siRNA-induced knockdown of Lockd in NIH/3T3 cells (left) and primary fibroblasts (right) measured by RT–qPCR. c, Scatterplot representing the magnitudes of fold changes of gene expression (shLockd/shControl) for significant genes (SCDE P < 0.05, two-sided test using the multiple testing-corrected (Holm procedure) z-score) of stably transduced NIH/3T3 cells (x axis) against gene correlations to Lockd in stably shControl-transduced NIH/3T3 cells (y axis). Genes reaching the threshold of Spearman correlations (±0.1, denoted with red dashed lines) were considered for downstream analysis. d, Relative expression of candidate genes on siRNA-induced knockdown of Lockd in NIH/3T3 cells measured by RT–qPCR. e, Relative expression of candidate genes on siRNA-induced knockdown of Lockd in primary fibroblast cells measured by RT–qPCR. a,b,d,e, n = 4 biologically independent samples, data presented as mean values ± s.e.m, P values represent a two-sided Student’s t-test.

