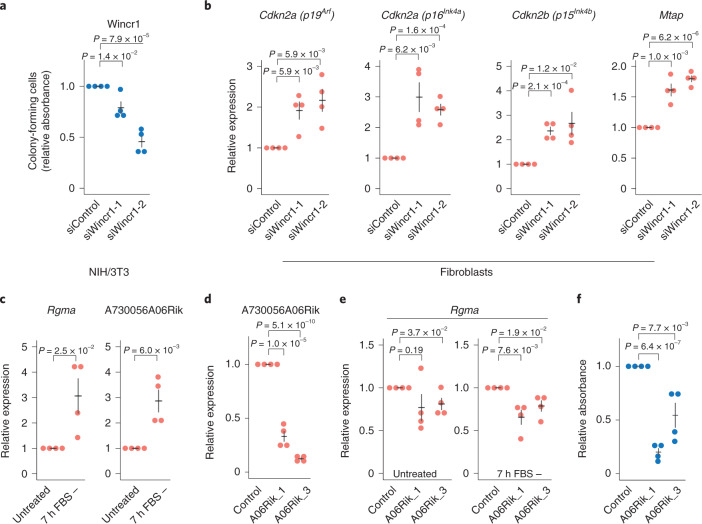
Fig. 5. Functional analysis of lncRNAs Wincr1 and A730056A06Rik.
a, Quantification of colony-forming cells on siRNA-induced knockdown of Wincr1 in NIH/3T3 cells. b, Relative expression of candidate cis-interacting genes on siRNA-induced knockdown of Wincr1 in primary fibroblast cells measured by RT–qPCR. c, Relative expression of Rgma and A730056A06Rik measured by RT–qPCR after 7-h serum starvation in NIH/3T3 cells. d, Relative expression of A730056A06Rik on ASO-mediated knockdown in NIH/3T3 cells measured by RT–qPCR. e, Relative expression of Rgma on serum starvation and ASO-induced knockdown of A730056A06Rik measured by RT–qPCR. f, Quantification of colony-forming cells on ASO-induced knockdown of A730056A06Rik in NIH/3T3 cells. Throughout the figure, n = 4 biologically independent samples; data are presented as mean values ± s.e.m.; P values represent a two-sided Student’s t-test.

