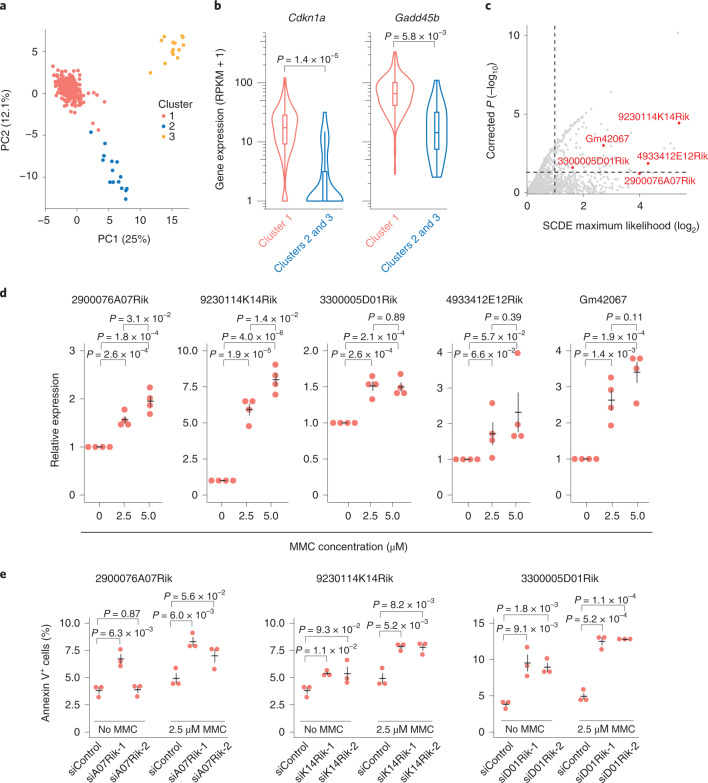
Fig. 6. Identification of lncRNAs involved in apoptosis by single-cell profiling.
a, Low-dimensional PCA projection of cells using the most variable apoptosis-related genes. Cells are colored according to clusters. b, Violin plots showing the expression levels of two marker genes (box plots: the center lines show the medians, the interquartile limits indicate the 25th and 75th percentiles, the whiskers denote the farthest points at a maximum of 1.5 times the IQR; P values represent a two-sided Wilcoxon test). c, Scatterplot showing the fold change magnitudes (x axis, SCDE maximum likelihood estimate of the fold change) and significance levels (y axis, SCDE P value, two-sided test using the multiple testing-corrected (Holm procedure) z-score) for cluster 1 against clusters 2 and 3 identified in a. The lncRNAs selected for validation are marked in red. d, Relative expression measured by RT–qPCR of candidate lncRNAs in NIH/3T3 cells treated with MMC (n = 4 biologically independent samples). e, Quantification of apoptosis using annexin V for siRNA-targeted NIH/3T3 cells treated with MMC (n = 3 biologically independent samples). d,e, Data are presented as mean values ± s.e.m.; P values represent a two-sided Student’s t-test.

