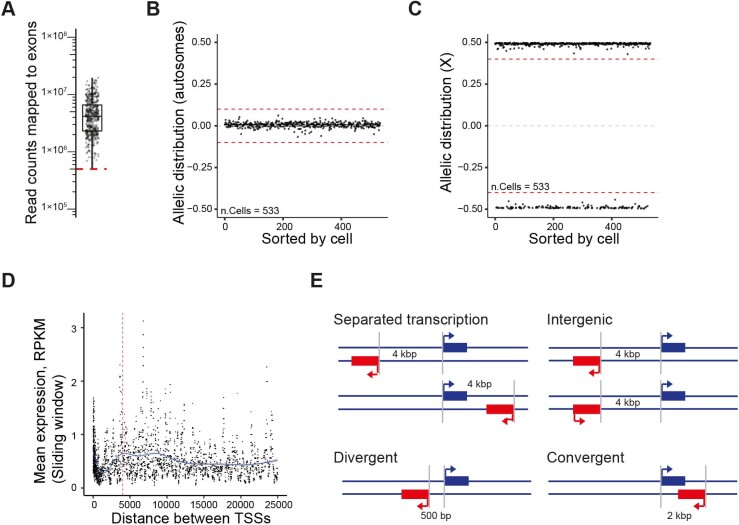
Extended Data Fig. 1. Quality controls for allele-sensitive scRNA-seq data.
(A) Boxplot showing number of sequenced read counts mapped to genes (Smart-seq2 libraries, n = 533 cells). The center line shows the median, interquartile limits indicate the 25th and 75th percentiles and whiskers denote the farthest points at a maximum of 1.5 times the interquartile range. The red line represents quality control cutoff. (B) Scatter plot showing the distribution of allele sensitive read counts ((countsCAST / (countsCAST + countsC57) − 0.5)) for non-imprinted autosomal genes (red dashed lines represent quality control cutoffs). (C) Scatter plot showing the distribution of allele sensitive read counts for non-escapee genes on the X-chromosome (red dashed lines represent quality control cutoff). (D) Mean expression against the distance between two promoters. The blue line denotes a generalized additive mode smoothing (gam) fitted to the sliding median (median RPKM, Width=51). The red dashed line represents the cutoff in distance between two promoters for being considered as separated transcriptional unit (4 kb). (E) Schematic representation of organizations of genes and the nomenclature used in this manuscript.

