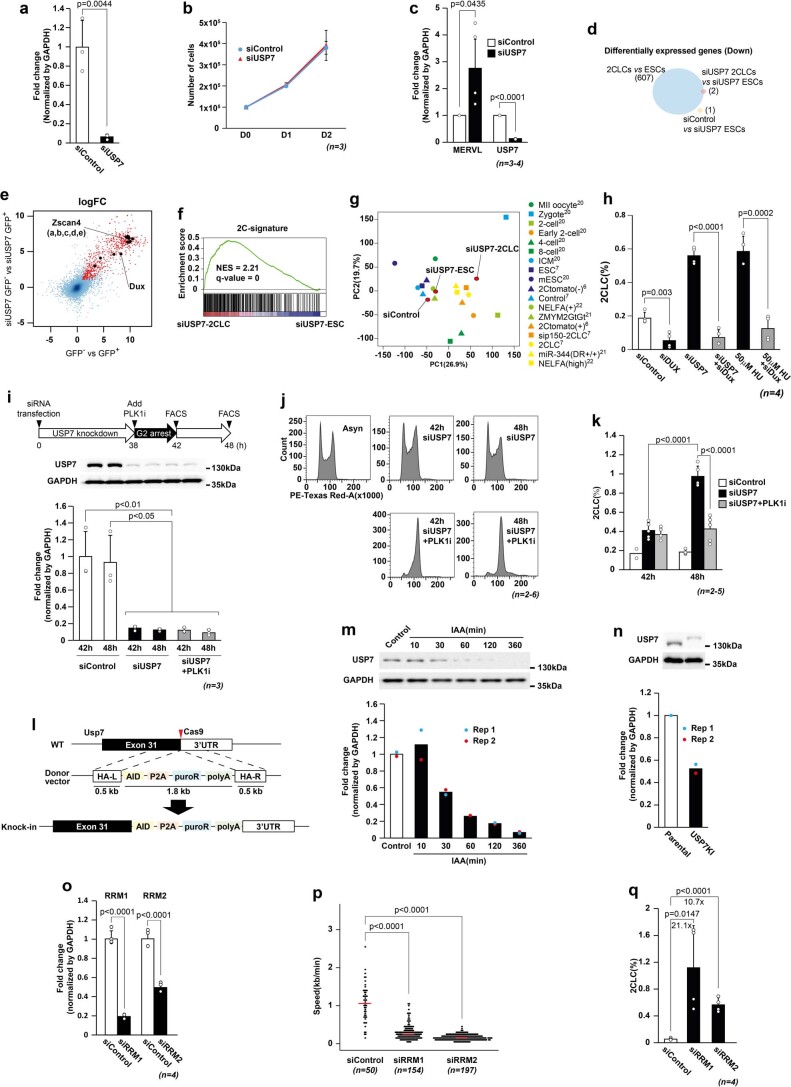
Extended Data Fig. 4. S-phase-dependent effect of USP7 on the emergence of 2CLCs.
a. USP7 protein quantification upon Usp7 siRNA (corresponds to Fig.3a). Statistical comparisons: two-sided Welch’s t-test. b. Growth curve after Usp7 RNAi at day 1(D1) 2(D2) after seeding(D0). c. MERVL and Usp7 qRT-QPCR upon Usp7 RNAi. Statistical comparisons: two-sided Welch’s t-test. d. Venn diagram comparing downregulated genes in control, USP7-depleted ESCs, and USP7-depleted 2CLCs. e. logFC scatter plots between siUSP7-2CLCs and endogenous 2CLCs showing high overlap of upregulated genes (red) between both 2CLC samples. f. Gene-set enrichment analysis of siUSP7-induced 2CLCs against a ‘2C’ signature. g. PCA of siControl, siUSP7 ESCs (GFP− cells) and siUSP7-induced 2CLCs transcriptomes compared with embryos and other 2CLC datasets. h. 2CLC percentage upon siRNA for Usp7 or HU treatment combined with siRNA for Dux. Statistical comparisons: two-sided Student’s t-test for pairwise comparison only between the indicated groups. i. Western Blot after Usp7 siRNA or control siRNA transfection and treatment of PLK1 inhibitor at indicated times. Statistical comparisons: two-sided Student’s t-test between each sample. Highest p-values are shown. j-k. Cell cycle profiles of ESCs (j) and 2CLC percentage (k) after transfection of control or Usp7 siRNA, followed by treatment with PLK1 inhibitor at indicated times. In (k) n for 42 h control samples is 2 biological replicates; for 48 h control is 4 and for all other samples is 5. Statistical comparisons between the indicated groups: two-sided Student’s t-test. l. Usp7 gene locus and knock-in strategy to insert Auxin-Inducible Degron (AID) at the C-terminus of USP7. m. Western Blot of USP7 after auxin (IAA) treatment. n. Western Blot in parental and knock-in USP7-AID line. The USP7-AID transgene causes lower USP7 expression compared to the parental clone, presumably leading to higher steady-state 2CLC population. o. Rrm1 and Rrm2 RT-qPCR 48 h after transfection with their respective siRNAs compared to control. Statistical comparisons: two-sided Welch’s t-test. p. Fork speed upon RNAi for RRM1, RRM2 or control. Statistical analysis: two-sided Wilcoxon rank-sum test. q. 2CLCs quantification 48 h after siRNA transfection. Statistical analysis: two-sided Student’s t-test. In bar graphs plots are mean±S.D and dots are individual replicate values. n: number of independent biological replicates. In m and n, dots are values from biological replicates.

