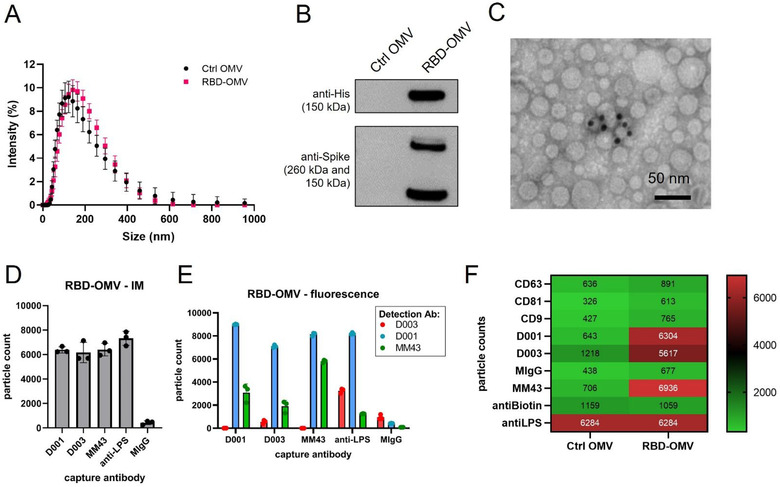
FIGURE 3.

RBD‐OMV characterization. (A) Particle concentration and size were determined by DLS. Ctrl‐OMVs and RBD‐OMVs had comparable particle size distribution, with a mean diameter of 118 nm for Ctrl OMV and 125.6 nm for RBD‐OMVs. (B) Western blot of Ctrl‐OMVs and RBD‐OMVs probed with anti‐His and anti‐Spike antibodies. (C) Immunogold transmission electron micrograph with anti‐Spike‐MM43 and streptavidin‐gold (10 nm). (D) SP‐IRIS of RBD‐OMVs captured by antibodies against Spike (D001, D003, MM43), anti‐LPS, and mouse‐IgG isotype control (MIgG). Interferometric imaging (IM) results are light grey bars. Data points show particle counts per capture spot, n = 3 capture spots. (E) Labelling with fluorescently labelled antibodies D001, D003, and MM43 shows localization of CoV2‐Spike epitopes on RBD‐OMVs (coloured bars). Data points show particle counts per capture spot, n = 3 capture spots. (F) Heatmap of SP‐IRIS data comparing RBD‐OMVs from (D) and Ctrl‐OMVs. Particle counts for each marker were normalized by LPS content (see also Figure S2)
