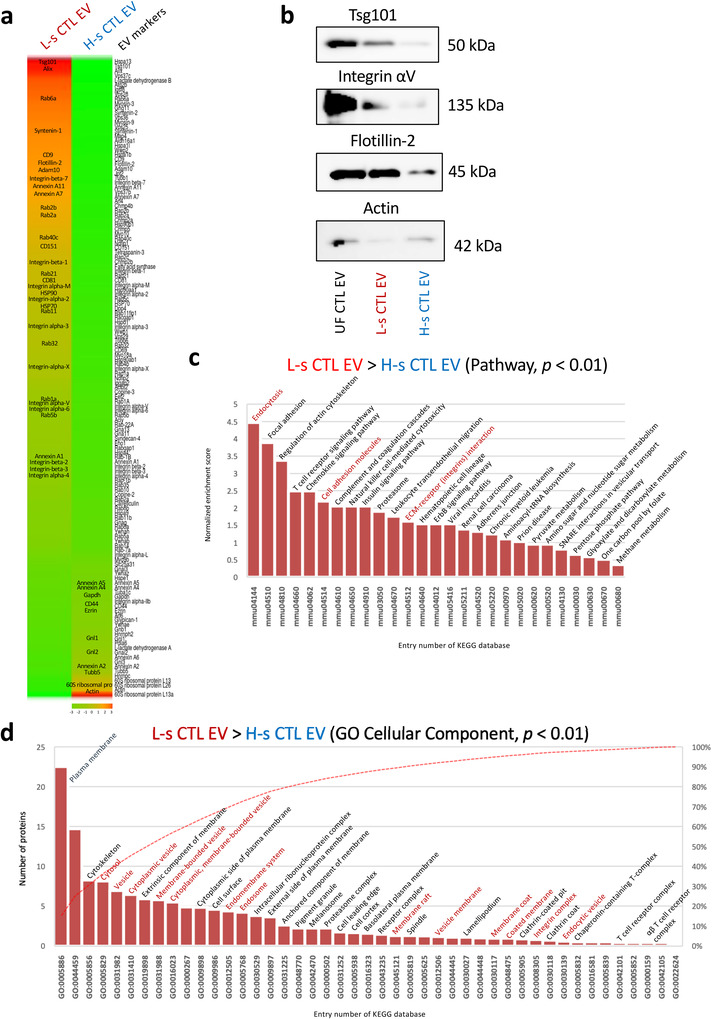
FIGURE 3.

L‐s CTL EVs as the exosomes of late endosome origin. (a) Abundance of L‐s CTL EV and H‐s CTL EV proteins is showed by a heat map of reported EV marker proteins. Crucial EV proteins are described in the heat map column. (b) To confirm the abundance ratio, a western blot analysis of L‐s, H‐s, and UC CTL EV proteins was conducted using Tsg101, Integrin αV, Flotillin‐2, and Actin mAbs. (c) A pathway analysis was conducted for all L‐s CTL EV‐dominant proteins (p < 0.01, Fisher's extract test) compared with H‐s CTL EV proteins using Kyoto Encyclopedia of Genes and Genomes (KEGG) database. (d) L‐s CTL EV‐dominant proteins (p < 0.01, Fisher's extract test), compared with H‐s CTL EV proteins were analyzed using the gene ontology (GO) cellular component (KEGG database). Analyzes of the pathway and GO cellular component were applied using DAVID Bioinformatics Resources 6.8. Statistical significance was set at p < 0.05, and only p < 0.01 was shown.
