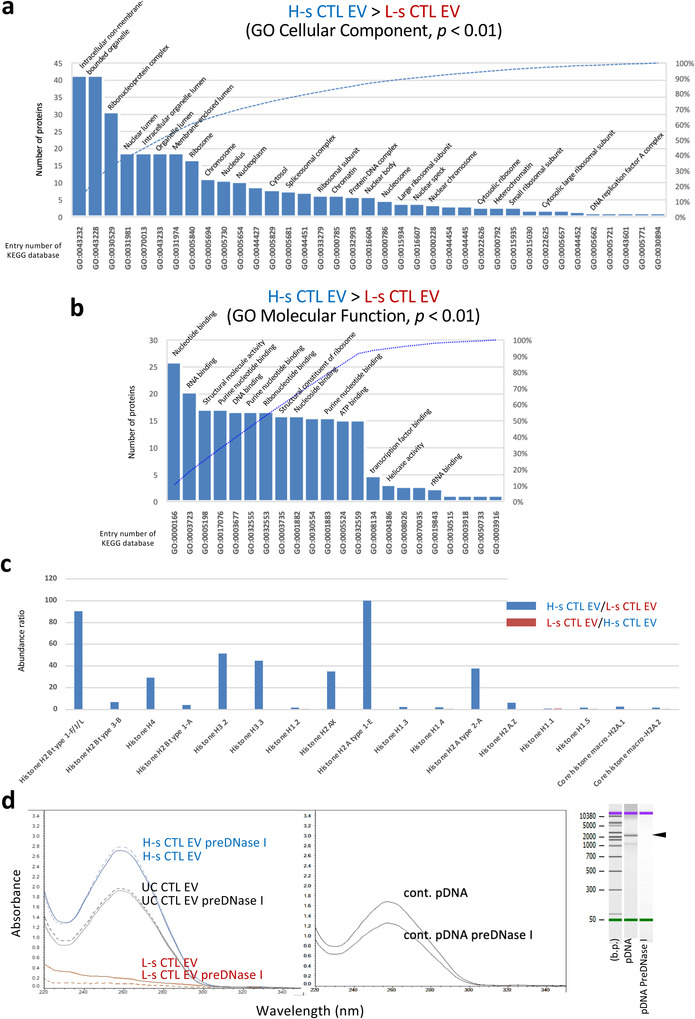
FIGURE 4.

H‐s CTL EVs as a Nucleic Acid Cargo. (a and b) H‐s CTL EV‐dominant proteins (p < 0.01, Fisher's extract test), compared with L‐s CTL EV proteins were analyzed using GO cellular component and GO molecular function. (c) Abundance ratio of the histone proteins was calculated in cases of H‐s CTL EVs/L‐s CTL EVs (blue) and L‐s CTL EVs/H‐s CTL EVs (red) using normalized raw data. (d) DNA was extracted from 5 × 10⁹ particles of L‐s, H‐s, or UC CTL EVs pretreated with/without DNase I, and the UV absorbance was measured (left). To confirm the DNase I activity, 2.2 kbp plasmid DNA treated with/without DNase I at the same concentration with the EV treatment was extracted by DNA extraction kit, and the UV absorbance was measured (middle). The degradation of plasmid DNA was visualized through electrophoresis using a bioanalyzer (right). Analyzes of the pathways, GO cellular component, and GO molecular function were conducted using KEGG database in DAVID Bioinformatics Resources 6.8. Statistical significance was set at p < 0.05, and only p < 0.01 was shown.
