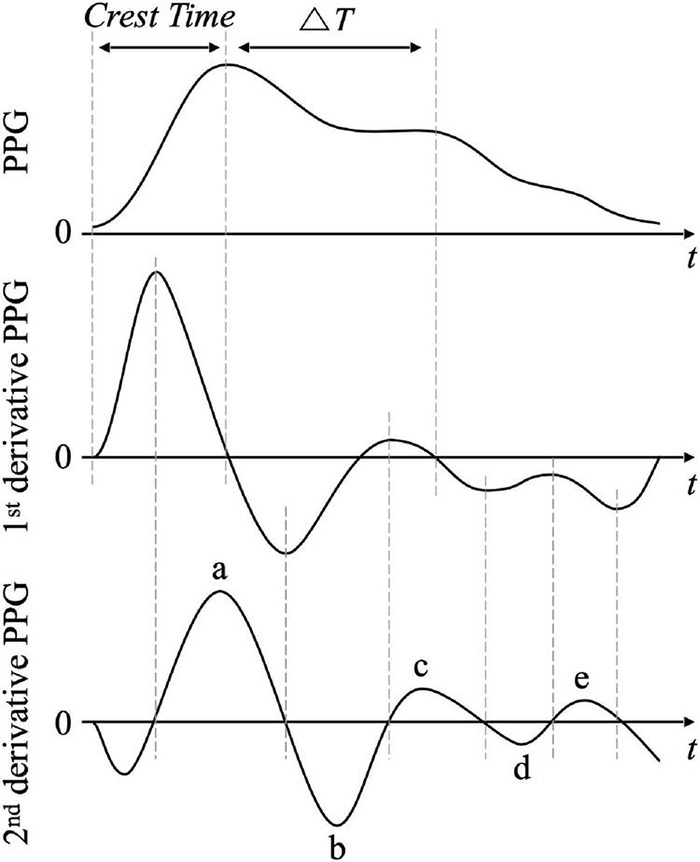
FIGURE 5.

Waveform and features of photoplethysmogram (PPG, top), derivative PPG (middle), and second derivative PPG (bottom). Crest time is the elapsed time from pulse onset to systolic peak. ΔT is the time interval between systolic peak and diastolic peak that is defined by the second downward zero-crossing time in derivative PPG. In the second derivative PPG, a, b, c, d, and e are the early systolic positive peak, early systolic negative peak, late systolic re-increasing peak, late systolic re-decreasing peak, and early diastolic positive peak, respectively.
