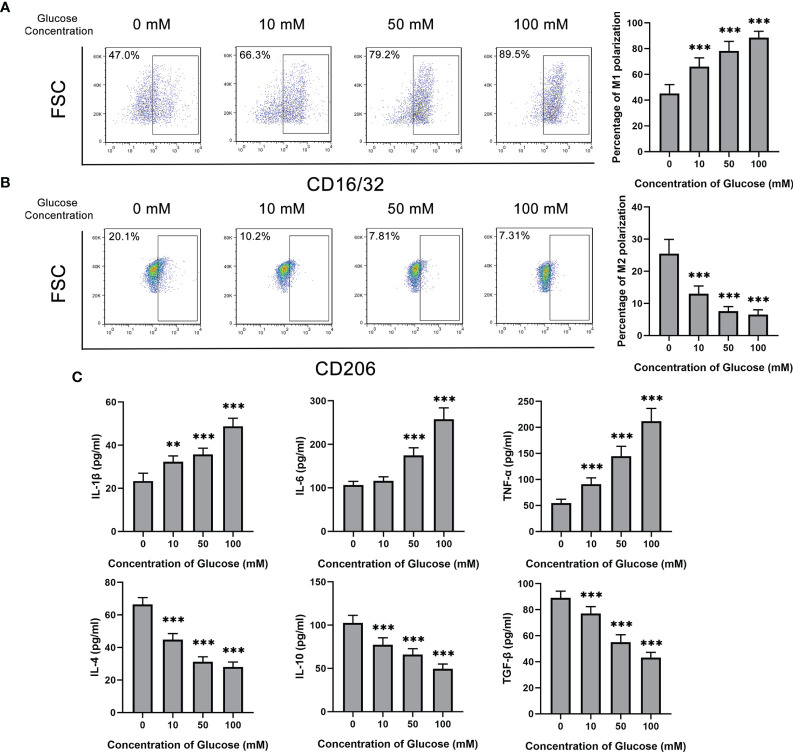
Figure 2.
Glucose promoted M1 polarization but inhibited M2 polarization of microglia. (A) The percentage of CD16/32+ M1 microglia gradually increased with glucose treatment from the concentration of 0 to 100 mM. (B) The percentage of CD206+ M2 microglia gradually decreased with glucose treatment from the concentration of 0 to 100 mM. (C) The secretion levels of IL-1β, IL-6 and TNF-α up-regulated with the increase of glucose concentration, and the secretion levels of IL-4, IL-10 and TGF-β down-regulated with the decrement of glucose concentration. Values are presented as the mean ± SD. ** indicates P < 0.01, and *** indicates P < 0.001.

