Figure 3.
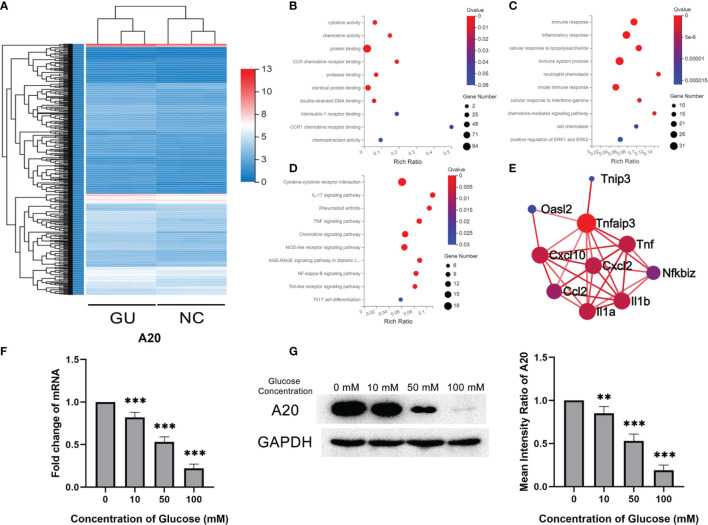
A20 expression of microglia decreased with glucose stimulation. (A) The heatmap of differentially expression gene profiles. (B) The top 10 enriched categories of molecular function in GO analysis. (C) The top 10 enriched categories of biological processes in GO analysis. (D) The top 10 enriched signal pathways of KEGG analysis. (E) The PPI network of differentially expressed mRNA. (F) The A20 expression at mRNA level decreased from 10 to 100 mM glucose treatment. (G) The A20 expression at protein levels decreased with 50 and 100 mM glucose treatment. Values are presented as the mean ± SD. ** indicates P < 0.01, and *** indicates P < 0.001.

