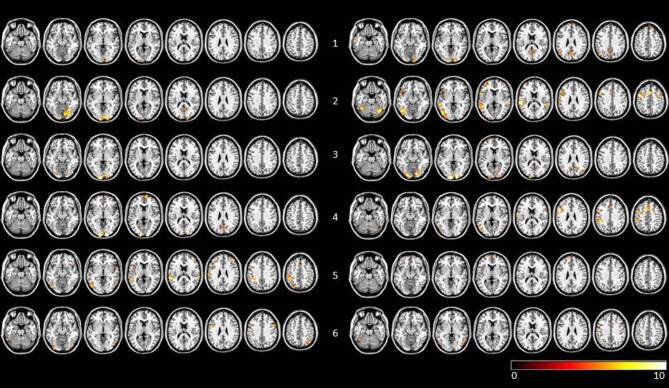
Fig. 1.
Visualization of FFX results of pretherapy and posttherapy n-back task runs for AP + CR subjects (FWE corrected, p < 0.005). Row labelling refers to subject number. To the left of the subject number individual scans before therapy are shown, to the right of the subject number the scans after therapy are shown. Data are visualized on a standard template using MRIcron. AP + CR group subjects with atypical antipsychotics and cognitive remediation, FFX fixed effects analysis, FWE family-wise error

