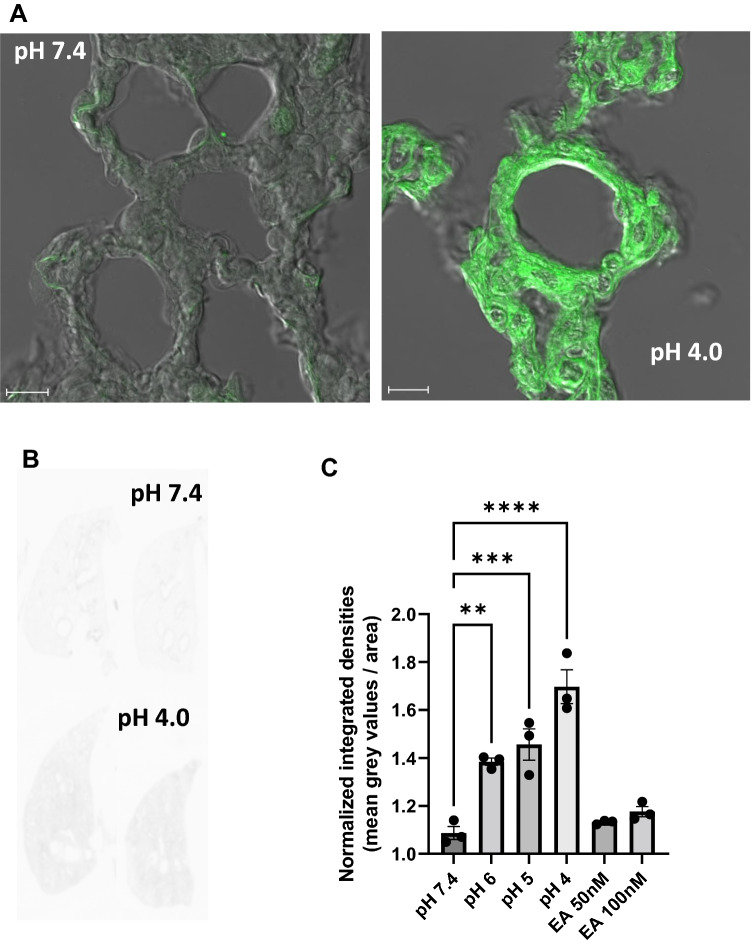
Fig. 5.
Tissue permeation of fluorescein isothiocyanate (FITC) dextrane particle after perfusion of lungs at pH 7.4 and after a short (10 min) drop of the pH to 4.0. Two representative overlays of FITC fluorescence and coresponding differential interference contrast (DIC) images showing lung tissues after perfusion of electrolyte solution (pH 7.4) and after a short (10 min) drop in pH (pH 4.0) are depicted (A). Two representative scans from total lungs at pH 7.4 and after a short (10 min) drop of the pH to 4.0 (B). Normalized integrated densities of lungs after a short (10 min) drop of the pH to 6.0, 5.0 and 4.0 or perfused with EA (50 and 100 nM) were normalized to lungs perfused with electrolyte solution at pH 7.4 and plotted as columns. Data are means ± SEM. p values were calculated by two way ANOVA and are indicated by asterisks (*, p < 0.05)

