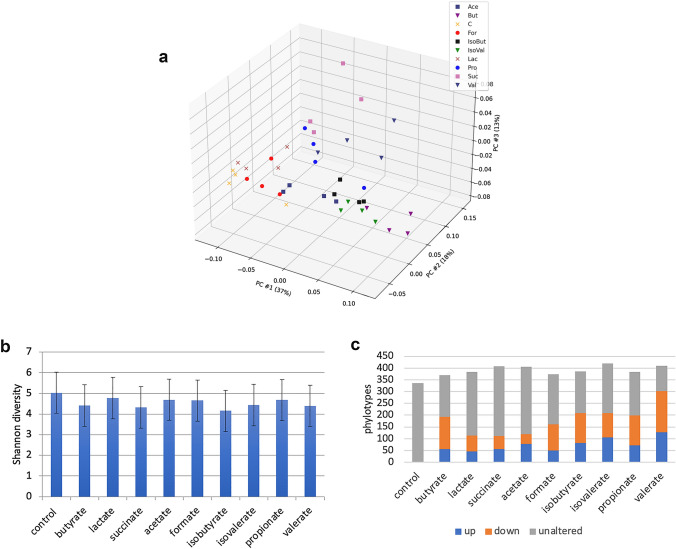
Fig. 1.
Principal component analysis of SCFA-supplemented cultures. a Bray–Curtis β diversity measures of control cultures compared to those supplemented with SCFAs. b Alpha diversity. Shannon diversity measures for control cultures compared to those observed in CDM supplemented with a single SCFA. c Modulatory effects of SCFAs. The average relative abundance of individual taxa in SCFA-supplemented cultures was compared to control cultures. Taxa displaying increased or decreased relative abundance (>fivefold) and the sum of these groups were summed and reported as altered. Taxa displaying changes < fivefold relative to control cultures were summed and reported as unaltered

