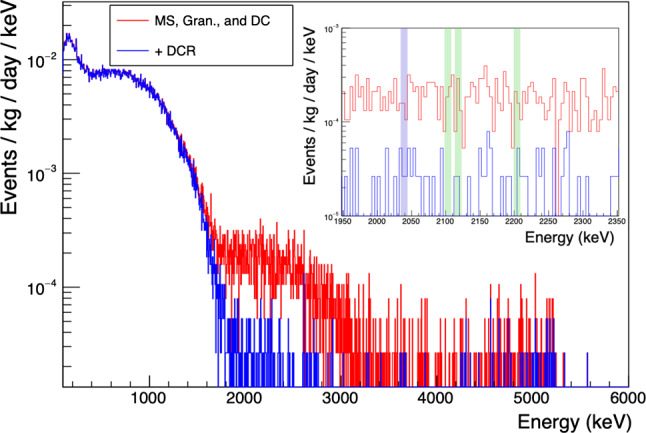
Fig. 14.

Energy spectra from the Majorana Demonstrator’s enriched detectors, including all data from Datasets 0 through 6 [7]. The red lines indicate the events kept by all other analyses (data cleaning, environmental, muon veto, multiplicity, and A vs. E multi-site cuts). The blue line shows the events remaining after all cuts, including the DCR cut. The inset shows the effect of the DCR cut in the background estimation window. The regions excluded due to backgrounds are shaded in green and the 10 keV window centered on is shaded in blue
