
Fig. 17.
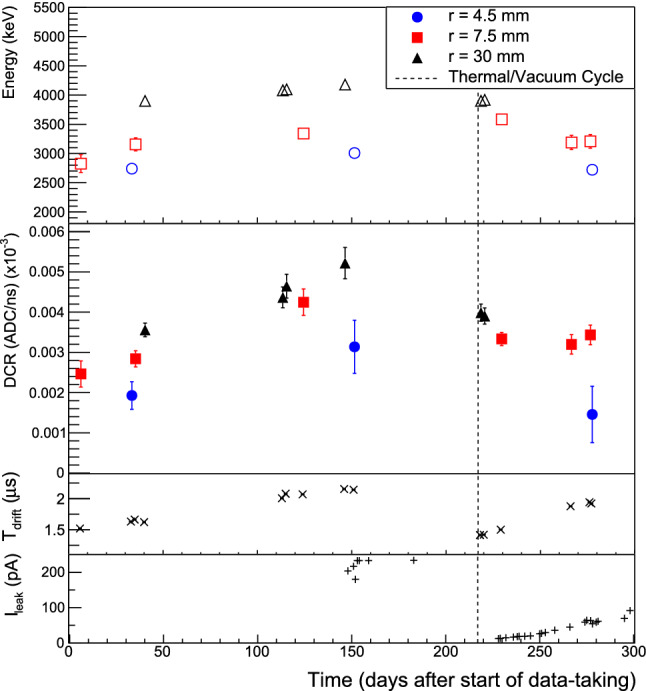
Stability studies of surface event charge collection conditions. The thermal and vacuum cycle date is indicated by the dashed line. Top: energies of the peak with the source incident at several positions on the passivated surface, with positive and negative-radii scans combined. Second from top: DCR values of the peak in the same data sets. The error bars in the energy and DCR plots indicate the width of the peak. Second from bottom: the long drift time peak centroid (see fit results in Fig. 18) in each of the data sets displayed in the upper panels. Bottom: the steady-state leakage current in the detector, measured at the test point of the 2002c Mirion preamplifier