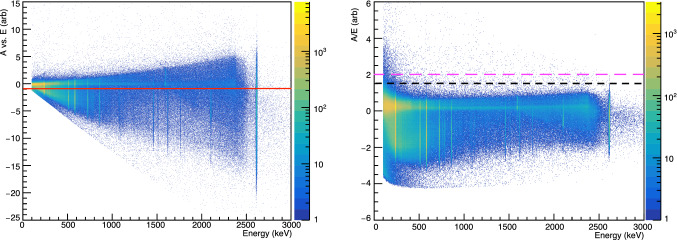
Fig. 4.
The distribution of A vs. E (left) and A/E (right) values with respect to energy is shown for calibration events after the muon veto is applied. The color scale indicates the number of events. A vs. E is used to identify multi-site background events; all events with A vs. E less than -1 (indicated by the red line) are rejected. A/E is used to identify near-p contact events; 99.9% of bulk events with energies between 1 and 2.63 MeV have A/E less than 2 (indicated by the dashed magenta line), and 99.8% have A/E less than 1.5 (indicated by the dashed black line)

