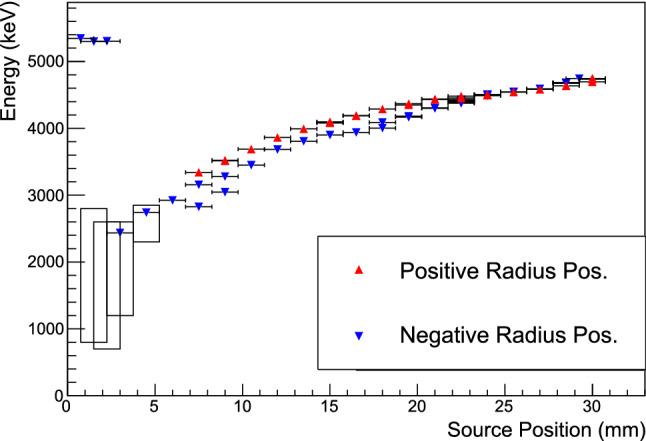
Fig. 6.

The centroids of the energy peaks in each data set; certain positions were studied in multiple data sets. Negative (positive) radius positions are indicated by blue downward-pointing (red upward-pointing) triangles. For scanning positions with significant low-energy tailing, the black box depicts the estimated full energy range of events. At positions that are partially or completely incident on the point-contact, an additional peak appears at nearly the full incident energy. The vertical error bars (not visible) depict the uncertainty in the peak position from the maximum-likelihood fit of the peaks, and the horizontal errors depict the 0.75 mm estimated uncertainty of the source position. The observed instability of the peak energies is discussed in Appendix E
