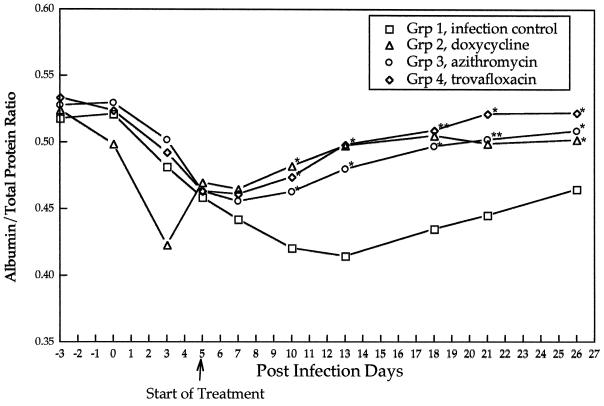
FIG. 3.
Mean ratios of albumin to total protein for the infection control group and the treatment groups after inoculation with R. rickettsii (day 0) and after initiation of antibiotic treatments (day 5). Asterisks indicate points at which treatment groups differ significantly from the infection control group.

