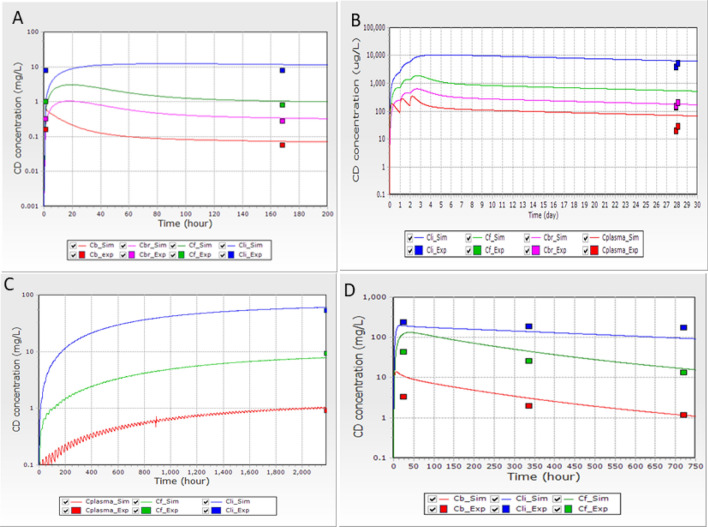
Fig. 2.
A Distribution of CD following a single intravenous exposure to 1 mg CD/kg bw. The experimental data were from Bungay et al. (1981). B Distribution of CD following exposure to 0.33 mg of CD/kg bw in the diet for three days. The experimental data were from Richter et al. (1979). C Distribution of CD following oral exposure to 5 ppm in the diet for 90 days and sampling 24 h after the last exposure on day 91 (2184 h the beginning of the treatment). The experimental data were from Linder et al. (1983). D Distribution of CD in male rats after a single oral dose of 40 mg/kg bw. The experimental data were from Belfiore et al. (2007). _Sim is the simulation profile and _Exp is the experimental data measured. The CD concentration (mg/L) or (µg/L) is shown on the Y axes and the hours or days on the X axes. Cb CD in the blood, Cbr CD in the brain, CF CD in the adipose tissue, CLi CD in the liver

