
Fig. 4.
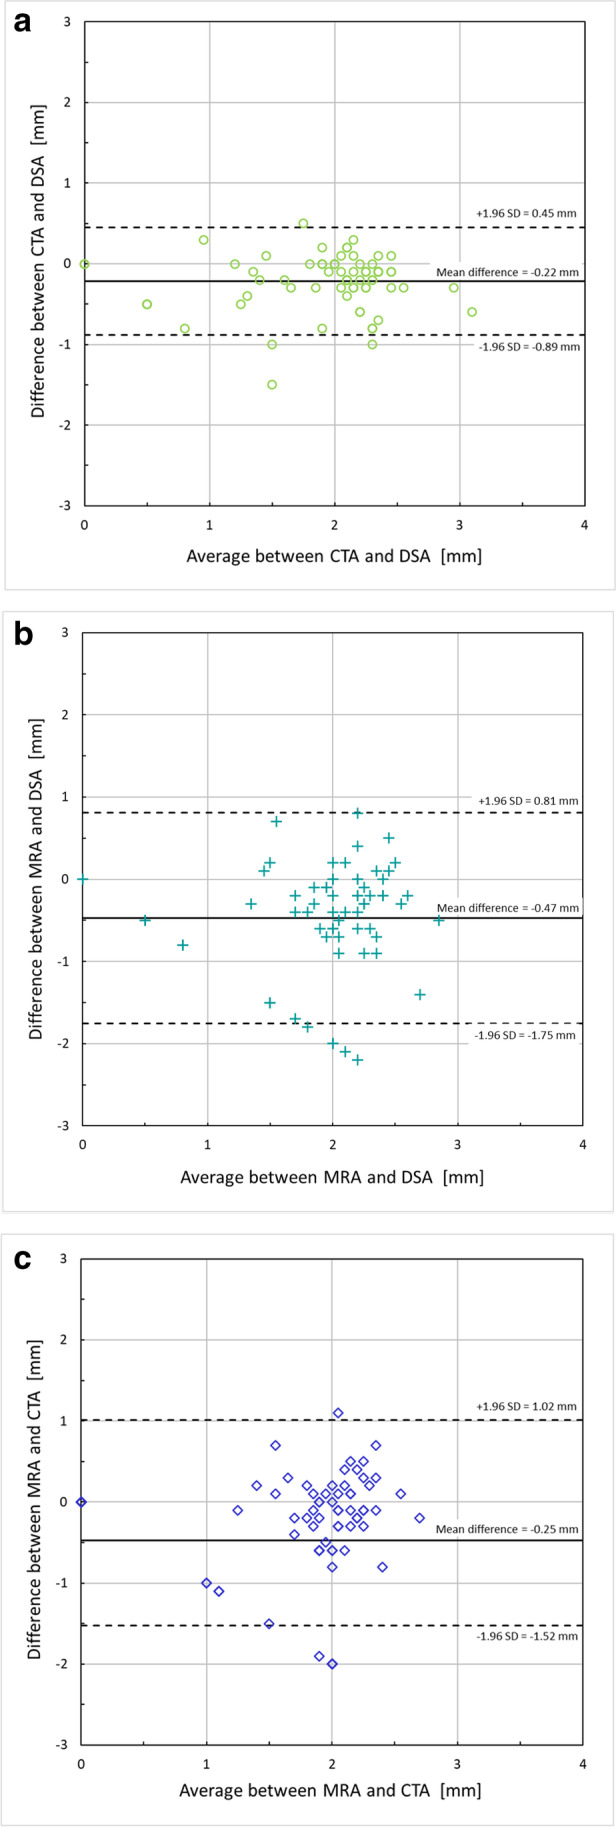
a The difference in the measured lumen diameters between CTA and DSA is given as a function of the mean value of the measured lumen diameters in CTA and DSA. The solid line indicates the mean value of the difference in lumen diameters and the dotted lines indicate the corresponding upper and lower confidence levels. b The difference in the measured lumen diameters between MRA and DSA is given as a function of the mean value of the measured lumen diameters in MRA and DSA. The solid line indicates the mean value of the difference in lumen diameters and the dotted lines indicate the corresponding upper and lower confidence levels. c The difference in the measured lumen diameters between MRA and CTA is given as a function of the mean value of the measured lumen diameters in MRA and CTA. The solid line indicates the mean value of the difference in lumen diameters and the dotted lines indicate the corresponding upper and lower confidence levels. Abbreviations: CTA = computed tomography angiography, DSA = digital subtraction angiography, MRA = magnetic resonance angiography, and MIP = maximal intensity projection